A Simpler, Fairer Tax Code That Responsibly Invests in Middle Class Families
Middle class families today bear too much of the tax burden because of unfair loopholes that are only available to the wealthy and big corporations. In his State of the Union address, the President will outline his plan to simplify our complex tax code for individuals, make it fairer by eliminating some of the biggest loopholes, and use the savings to responsibly pay for the investments we need to help middle class families get ahead and grow the economy.
The President will put forward reforms that include eliminating the biggest loophole that lets the wealthiest avoid paying their fair share of taxes:
Close the trust fund loophole – the single largest capital gains tax loophole – to ensure the wealthiest Americans pay their fair share on inherited assets. Hundreds of billions of dollars escape capital gains taxation each year because of the “stepped-up” basis loophole that lets the wealthy pass appreciated assets onto their heirs tax-free.
Raise the top capital gains and dividend rate back to the rate under President Reagan. The President’s plan would increase the total capital gains and dividends rates for high-income households to 28 percent.
Reform financial sector taxation to make it more costly for the biggest financial firms to finance their activities with excessive borrowing. The President will propose a fee on large, highly-leveraged financial institutions to discourage excessive borrowing.
By ensuring those at the top pay their fair share in taxes, the President’s plan responsibly pays for investments we need to help middle class families get ahead, like his recent proposal to make two years of community college free for every student willing to do the work. The savings will pay for additional reforms that will help the paychecks of middle-class and working families go further to cover the cost of child care, college, and a secure retirement:
Provide a new, simple tax credit to two-earner families. The President will propose a new $500 second earner credit to help cover the additional costs faced by families in which both spouses work — benefiting 24 million couples.
Streamline child care tax incentives to give middle-class families with young children a tax cut of up to $3,000 per child. The President’s proposal would streamline and dramatically expand child care tax benefits, helping 5.1 million families cover child care costs for 6.7 million children. The proposal will complement major new investments in the President’s Budget to improve child care quality, access, and affordability for working families.
Simplify, consolidate, and expand education tax benefits to improve college affordability. The President’s plan will consolidate six overlapping education provisions into just two, while improving the American Opportunity Tax Credit to provide more students up to $2,500 each year over five years as they work toward a college degree – cutting taxes for 8.5 million families and students and simplifying taxes for the more than 25 million families and students that claim education tax benefits.
Make it easy and automatic for workers to save for retirement. The President will put forward a retirement tax reform plan that gives 30 million additional workers the opportunity to easily save for retirement through their employer.
These new policies build on longstanding proposals to extend important tax credit improvements for working families, expand the Earned Income Tax Credit, provide quality preschool for all four-year-olds, and raise revenue to reduce the deficit by curbing inefficient tax breaks that primarily benefit the wealthy. In addition, the President has put forward a framework for fixing the business tax system on a revenue- neutral basis and using the transition revenue to pay for investments in infrastructure.
Eliminating the Biggest Loopholes that let the Wealthiest Avoid Paying Their Fair Share of Taxes and Reforming Financial Sector Taxation
Reforming the Taxation of Capital Gains
Rather than make it easier for middle-class families to make ends meet, our tax system has changed over time in ways that make it easier for the wealthy to avoid paying their fair share. Though President Obama restored top tax rates on the highest income Americans to their levels under President Clinton, high-income tax rates remain historically low, especially on capital income. Capital income taxes are also much lower than tax rates on income from work, which explains how the highest-income 400 taxpayers in 2012 – who obtained 68 percent of their income from capital gains – paid income tax at an effective rate of 17 percent, even though the top marginal income tax rate was 35 percent.
The problem is that the U.S. capital income tax system is too broken to address this unfairness just by raising tax rates. Current rules let substantial capital gains income escape tax altogether. Raising the capital gains rate without also addressing these loopholes would encourage wealthy individuals to take further advantage of the opportunities the current system provides to defer and avoid tax.
The largest capital gains loophole – perhaps the largest single loophole in the entire individual income tax code – is a provision known as “stepped-up basis.” Stepped-up basis refers to the fact that capital gains on assets held until death are never subject to income taxes. Not only do bequests to heirs go untaxed, but the “tax basis” of inherited assets used to compute the gain if they are later sold is immediately increased (“stepped-up”) to the value at the date of death – making the capital gain income forever exempt from taxes. For example, suppose an individual leaves stock worth $50 million to an heir, who immediately sells it. When purchased, the stock was worth $10 million, so the capital gain is $40 million. However, the heir’s basis in the stock is “stepped up” to the $50 million gain when he inherited it – so no income tax is due on the sale, or ever due on the $40 million of gain. Each year, hundreds of billions in capital gains avoid tax as a result of stepped-up basis.
The President’s proposal would close the stepped-up basis loophole by treating bequests and gifts other than to charitable organizations as realization events, like other cases where assets change hands. It would also increase the total top capital gains and dividend rate to 28 percent – the rate under President Reagan. (The top rate applies to couples with incomes over about $500,000.) It would:
Almost exclusively impact the top 1 percent. 99 percent of the impact of the President’s capital gains reform proposal (including eliminating stepped-up basis and raising the capital gains rate) would be on the top 1 percent, and more than 80 percent on the top 0.1 percent (those with incomes over $2 million). Under the President’s proposal, wealthy people would still get a preferential rate on their income from investments, but they would no longer be able to accumulate extra wealth by paying no capital gains tax whatsoever.
Address a basic unfairness in the tax system. Most middle-class retirees spend down their assets during retirement, which means they owe income taxes on whatever capital gains they’ve accrued. But the wealthy can often afford to hold onto assets until death – which is what lets them use the stepped-up basis loophole to avoid ever having to pay tax on capital gains. 
Unlock capital for productive investment. By letting very wealthy investors make their capital gains disappear at death, stepped-up basis creates strong “lock-in” incentives to hold assets for generations, even when resources could be reinvested more productively elsewhere. The proposal would sharply reduce these incentives, making it a pro-growth way to raise revenue.
Protect the middle-class and small businesses. To ensure that it would impose neither tax nor compliance burdens on middle-class families, the President’s proposal includes the following protections:
For couples, no tax would be due until the death of the second spouse.
Capital gains of up to $200,000 per couple ($100,000 per individual) could still be bequeathed free of tax. Note that, since capital gains generally represent only a fraction of an asset’s value, this exemption would allow couples to bequeath more than $200,000 without owing taxes. The exemption would be automatically portable between spouses.
In addition to the basic exemption, couples would have an additional $500,000 exemption for personal residences ($250,000 per individual). This exemption would also be automatically portable between spouses.
Tangible personal property other than expensive art and similar collectibles (e.g. bequests or gifts of clothing, furniture, and small family heirlooms) would be tax-exempt. In addition to avoiding any tax burden on these transfers, this exclusion would prevent families from having to value and report them.
As a result of these provisions, only a tiny minority of small businesses could possibly be affected by the repeal of stepped-up basis. However, the President’s proposal also includes extra protections that ensure no small family-owned business would ever have to be sold for tax reasons:
No tax would be due on inherited small, family-owned and operated businesses – unless and until the business was sold.
Any closely-held business would have the option to pay tax on gains over 15 years.
Imposing a Fee on Large Financial Institutions
The President’s proposal would make it more costly for the largest financial firms to finance their activities by borrowing heavily. Specifically, the President’s proposal would impose a 7 basis point fee on the liabilities of large U.S. financial firms: the roughly 100 firms in the nation with assets over $50 billion. The President’s proposal would attach a cost to leverage for the largest financial firms, leading them to make decisions more consistent with the economy-wide effects of their actions, which would in turn help reduce the probability of major defaults that can have widespread economic costs. This approach is broadly consistent with a proposal from former Ways and Means Chairman Camp’s tax reform plan that would have imposed an excise tax on large financial firms.
Reforming the Tax System to Better Support and Reward Work
Creating a New “Second Earner Credit” for Married Couples Where Both Spouses Work
Two-earner couples can face high penalties for working. When both spouses work, the family incurs additional costs in the form of commuting costs, professional expenses, child care, and, increasingly, elder care. When layered on top of other costs, including federal and state taxes, these work-related costs can contribute to a sense that work isn’t worth it, especially for parents of young children and couples caring for aging parents. While women, including married women, are increasingly family breadwinners, the fact remains that they are still much more likely to be the ones who withdraw from the labor force in these circumstances, taking a toll on their future job options and earnings, and hurting our overall economic growth.
Building on Congressional proposals from members of both parties, the President is proposing to address these challenges with a new second earner credit that recognizes the additional costs faced by families in which both spouses work. A total of 24 million couples would benefit from this proposal, which would provide a new, simple second earner credit of up to $500. Families would claim a credit equal to 5 percent of the first $10,000 of earnings for the lower-earning spouse in a married couple, and the maximum credit would be available to families with incomes up to $120,000, with a partial credit available up to $210,000. 80 percent of two-earner married couples would benefit from the new credit.
Expanding the EITC for Workers without Children and Noncustodial Parents
The President’s plan to help working families get ahead incorporates his proposed childless worker EITC expansion, reducing poverty and hardship for 13.2 million low-income workers struggling to make ends meet while promoting employment. The President’s proposal would double the EITC for workers without qualifying children, increase the income level at which the credit phases out, and make it available to workers age 21 and older. Ways and Means Committee Chairman Ryan has endorsed the President’s proposed expansion, while other members of Congress have put forward similar proposals.
The President also continues to propose making permanent improvements to the EITC and CTC that augment wages for 16 million families with 29 million children each year. These improvements provide additional benefits to low-income working parents, families with three or more children, and married families, but are currently scheduled to expire at the end of 2017. Allowing these benefits to expire would result in a roughly $1,700 tax increase for a full-time minimum wage worker with two children. Research has consistently shown that the helping low-wage working families through the EITC and CTC not only boosts parents’ employment rates and reduces poverty, but has positive longer-term effects on children, including improved health and educational outcomes.
Making Child Care, Education, and Retirement Tax Benefits Work for Middle-Class Families
Simplifying and Expanding Child Care Tax Benefits
With the cost of infant and toddler care rivaling the cost of college in many states, the average child care tax benefit of $550 falls well short of what is needed to provide meaningful help to working families. The Child and Dependent Care Tax Credit and child care flexible spending accounts are also unnecessarily complex, often requiring significant paperwork and advanced planning for families to receive the full benefits.
The President’s tax proposal would streamline child care tax benefits and triple the maximum child care credit for middle class families with young children, increasing it to $3,000 per child. The President’s child care tax proposals would benefit 5.1 million families, helping them cover child care costs for 6.7 million children (including 3.5 million children under 5), through the following reforms:
Triple the maximum Child and Dependent Care Tax Credit (CDCTC) for families with children under 5, increasing it to $3,000 per child. Families with young children face the highest child care costs. Under the President’s proposal, they could claim a 50 percent credit for up to $6,000 of expenses per child under 5 – covering up to half the cost of child care for preschool age children.
Make the full credit available to most middle-class families. Under current law, almost no families qualify for the maximum CDCTC. The President’s proposal would make the maximum credit – for young children, older children, and elderly or disabled dependents – available to families with incomes up to $120,000, meaning that most middle-class families could easily determine how much help they can get.
Eliminate complex child care flexible spending accounts and reinvest the savings in the improved CDCTC. The President’s proposal would replace the current system of complex and duplicative incentives with one generous and simple child care tax benefit. 
The President’s child care tax proposal will complement major new investments in the President’s Budget to improve child care quality, access, and affordability for working families.
Consolidating and Improving Education Tax Incentives
While the creation of the American Opportunity Tax Credit in 2009 made college more affordable for millions of students and their families, our system of tax incentives for higher education is complex, and families are sometimes unable to take full advantage of these benefits. In fact, the Government Accountability Office (GAO) found that 27 percent of families who claimed one tax benefit would have been better off claiming another, while 14 percent of eligible families failed to claim any benefit at all.
Building on bipartisan reform proposals, the President’s education tax reform plan would simplify, consolidate, and better target tax-based financial aid. The President’s plan would cut taxes for 8.5 million families and students, simplify taxes for the more than 25 million families and students that claim education tax benefits, and provide students working toward a college degree with up to $2,500 of assistance each year for five years. These education tax reforms would complement the President’s other proposals to make college more affordable, including continuing historic increases in the Pell scholarship program and making a quality community college education free for responsible students. Together, these proposals would benefit students, families, and the broader economy by helping more students earn a postsecondary credential. The President’s education tax reform plan would:
Simplify, consolidate, and better target tax benefits through an improved AOTC
Consolidate duplicative and less effective education benefits into a permanent, improved AOTC. Under current law, the AOTC is scheduled to expire after 2017 and revert to the less generous Hope tax credit. Under the President’s plan, the AOTC would be a permanent feature of the tax code, so that students in school today would not have to worry that these benefits will expire before they graduate; the credit would also grow with inflation. The Lifetime Learning Credit and the tuition and fees deduction would be consolidated into the more generous AOTC.
Increase the refundable portion of the AOTC to $1,500. The President’s plan adopts Congressional proposals – from members of both parties – to increase the refundable portion of the AOTC so that more working families and students can qualify. Like legislation that passed the House in 2014, the President’s plan would increase the refundable portion from a maximum of $1,000, or 40 percent of the total AOTC benefit, to a flat maximum of $1,500.
Expand AOTC eligibility for non-traditional students. Currently, students must be at least half-time to qualify for the AOTC, and families can claim the credit for no more than four years. Under the President’s plan, part- time students would be eligible for a $1,250 AOTC (up to $750 refundable) and all eligible students would be able to claim the AOTC for up to five years.
Make it easier for students and families to apply for tax credits
Improve information reporting. The proposal would require colleges and universities to provide students with the tuition and fee information needed to claim the AOTC.
Simplify taxes for approximately 9 million Pell Grant recipients. Currently, eligible families leave tens of millions of dollars of AOTC credits on the table because the rules related to Pell Grants and the AOTC are so complicated. Like bipartisan Congressional proposals, the President’s plan would exempt Pell Grants from taxation and the AOTC calculation, making it easier for Pell recipients to claim the tax benefits already available to them.
Better target and simplify tax relief for student debt and college savings
Eliminate tax on student loan debt forgiveness under Pay-As-You-Earn (PAYE) and other income-based repayment plans. The President has worked to make student debt affordable for struggling borrowers by offering PAYE: an income-based repayment plan that lets borrowers limit student loan payments to no more than 10 percent of their discretionary income and qualify for forgiveness after 20 years of repayments. The Department of Education is currently amending its rules to extend this option to all direct student loan borrowers. However, under current law, PAYE participants who qualify for debt forgiveness after 20 years could face a large tax bill – likely a surprise to most borrowers, and for others a concern in choosing PAYE. The President’s plan would continue to propose to exempt student loan forgiveness from taxation.
Repeal the complicated student loan interest deduction for new borrowers. The student loan interest deduction is complicated – so much so that many eligible borrowers fail to claim it – and provides very limited assistance ($100 on average) to a broad group of borrowers, rather than targeting more meaningful assistance to those borrowers struggling to afford their student loan payments. The President’s plan would retain the student loan interest deduction for current borrowers. But for new borrowers, his plan would repeal this complicated tax break and instead provide more generous and more targeted tax relief through the improved AOTC while students are in school and through PAYE once they graduate.
Limit upside-down education savings incentives and consolidate them into a single benefit. The President’s plan would consolidate education savings incentives into one vehicle and redirect the savings into the better targeted AOTC. Specifically, the President’s plan will roll back expanded tax cuts for 529 education savings plans that were enacted in 2001 for new contributions, and – like Chairman Camp’s tax reform plan – repeal tax incentives going forward for the much smaller Coverdell education savings program.
Reforming Retirement Tax Incentives and Expanding Savings Opportunities
Americans face a daunting array of choices when it comes to retirement savings. While some workers are automatically enrolled in a retirement savings plan by their employer (with an option to opt out), others have to open an account, manage contributions, and research and select investments on their own. Meanwhile, tax loopholes have allowed some high-income Americans to accumulate tens of millions of dollars in tax-preferred accounts that were intended to help workers save for a secure retirement, not to provide tax shelters for the wealthiest few.
The President’s retirement tax reform proposals would dramatically expand access to employer-based retirement savings options, whether a new “auto-IRA,” 401(k), or other employer plan. These proposals would give 30 million additional workers access to a workplace savings opportunity and would complement the President’s actions over the past year to make saving for retirement easier by creating the simple, risk-free, and low-cost “myRA” starter savings vehicle. The President’s reforms to make the system more robust for middle-class workers would be paid for by closing retirement tax loopholes for the wealthy. The President’s retirement tax reform plan would:
Automatically enroll Americans without access to a workplace retirement plan in an IRA. Under the proposal, every employer with more than 10 employees that does not currently offer a retirement plan would be required to automatically enroll their workers in an IRA. Auto-IRAs would let workers opt out of saving if they choose but would also let them start saving without sorting through a host of complex options. Auto-IRA proposals have been endorsed by independent scholars across the ideological spectrum, including those affiliated with AARP, the Brookings Institution and the Heritage Foundation.
Provide tax cuts for auto-IRA adoption, as well as for businesses that choose to offer employer plans or switch to auto-enrollment. To minimize the burden on small businesses, the President’s auto-IRA proposal would provide any employer with 100 or fewer employees who offers an auto-IRA a $3,000 tax credit. The President also proposes to triple the existing “start up” credit, so small employers who newly offer a retirement plan would receive a $4,500 tax credit – more than enough to offset administrative expenses. And because auto- enrollment is the most effective way to ensure workers with access to a plan participate, small employers who already offer a plan and add auto-enrollment would get an additional $1,500 tax credit.
Ensure long-term, part-time workers can contribute to their employer’s retirement plan. Only 37 percent of part-time workers have access to a workplace retirement plan. That’s partly because employers offering retirement plans are allowed to exclude employees who work less than 1,000 hours per year, no matter how long they’ve worked for the employer. The President proposes to expand access for part-time workers by requiring employers who offer plans to permit employees who have worked for the employer for at least 500 hours per year for 3 years or more to make voluntary contributions to the plan.
Prevent wealthy individuals from using loopholes to accumulate huge amounts of tax-favored retirement benefits. Tax-preferred retirement plans are intended to help working families save for retirement. But loopholes in the tax system have let some wealthy individuals convert tax-preferred retirement accounts into tax shelters, including 300 extraordinarily wealthy individuals who have accumulated more than $25 million each in IRAs. The President’s plan would prohibit contributions to and accruals of additional benefits in tax-preferred retirement plans and IRAs once balances are about $3.4 million, enough to provide an annual income of $210,000 in retirement.
45th Annual Meeting to Convene under Theme “The New Global Context”, as World Faces Critical Global Challenges
Geneva, Switzerland, – Over 40 heads of state and government, as well as 2,500 other leaders from business and society will convene at the 45th World Economic Forum Annual Meeting, from 21 to 24 January 2015 in Davos-Klosters, Switzerland, to discuss The New Global Context.
This context consists of 10 global challenges affecting the world today: environment and resource scarcity; employment skills and human capital; gender parity; long-term investing, infrastructure and development; food security and agriculture; international trade and investment; future of the internet; global crime and anti-corruption; social inclusion; and future of financial systems. Current affairs, such as the escalating geopolitical conflicts, pandemics, diverging growth and the new energy context are on the agenda as well.
“The World Economic Forum serves the international community as a platform for public-private cooperation,” said Klaus Schwab, Founder and Executive Chairman of the World Economic Forum. “Such cooperation, to address the challenges we all face, is more vital than ever before. But it requires mutual trust. My hope is that the Annual Meeting serves as the starting point for a renaissance of global trust.”
Ahmet Davutoğlu, Prime Minister of Turkey, Béji Caïd Essebsi, President of Tunisia, François Hollande, President of France, Li Keqiang, Prime Minister of the People’s Republic of China, Angela Merkel, Federal Chancellor of Germany, John Kerry, US Secretary of State, Muhammad Nawaz Sharif, Prime Minister of Pakistan, Matteo Renzi, Prime Minister of Italy, Simonetta Sommaruga, President of the Swiss Confederation, and Jacob Zuma, President of South Africa, will be among the key government representatives present.
Participants also include more than 1,500 business leaders from the Forum’s 1,000 Member companies, 300 public figures as well as recognized leaders from other Forum communities, including Social Entrepreneurs, Global Shapers, Young Global Leaders and Technology Pioneers. Representatives from international organizations and civil society, as well as religious leaders, cultural leaders, academia and the media will also participate.
The full programme consists of over 280 sessions out of which over 100 sessions will be live webcast. The themes include:
Crisis & Cooperation
Resolving geopolitical crises: With conflicts continuing to destabilize Ukraine, the Middle East and other parts of the world, what can the international community do to help bring about a lasting peace? Registered participants include Abdel Fatah El Sisi, President of Egypt, H.M. King Abdullah II Ibn Al Hussein, King of the Hashemite Kingdom of Jordan, Haïdar Al Abadi, Prime Minister of Iraq, Masoud Barzani, President of the Kurdistan Region, Iraq, Petro Poroshenko, President of Ukraine.
Repercussions of climate change: As the world prepares for another round of post-Kyoto climate negotiations, what are the chances for success at the climate meeting in Paris? And how can the private sector contribute?
Registered participants include Christiana Figueres, Executive Secretary, United Nations Framework Convention on Climate Change, Ollanta Moises Humala Tasso, President of Peru, and Al Gore, Vice-President of the United States (1993-2001); Chairman and Co-Founder, Generation Investment Management, USA
Pandemics and health: As the outbreak of Ebola has shown, combating the spread of viruses is still a worldwide priority. At the same time, non-communicable diseases such as diabetes are becoming the world’s biggest silent killer. What can the world do to ensure global health going forward? Registered participants include Kofi Annan, Chairman, Kofi Annan Foundation, Switzerland; Secretary-General, United Nations (1997-2006), Margaret Chan, Director-General, World Health Organization (WHO), Geneva, Alpha Condé, President of Guinea, Ibrahim Boubacar Keita, President of the Republic of Mali, and Peter Piot, Director, London School of Hygiene and Tropical Medicine; Executive Director, UNAIDS (1994-2008).
Growth & Stability
Diverging growth and monetary policies: As expansionary monetary policy in one part of the world comes to an end, central banks policies in other parts of the world are further incentivizing the growth and employment, with mixed results. What will 2015 bring in terms of growth and monetary policies around the world? Registered participants include Christine Lagarde, Managing Director, International Monetary Fund (IMF), and the Governors of the Central Banks of Brazil, Canada, England, France, Italy, Japan, Mexico and Switzerland.
The new energy context: As energy prices are dropping to five-year lows, what are the short- and long-term effects on the world? What does it mean for growth in emerging economies and the impact on climate change? Registered participants include Khalid Al Falih, President and Chief Executive Officer, Saudi Aramco, Mary Barra, Chief Executive Officer, General Motors Company, Abdalla Salem El Badri, Secretary-General, Organization of the Petroleum Exporting Countries (OPEC), Emilio Lozoya, Chief Executive Officer, Petroleos Mexicanos (PEMEX), and Patrick Pouyanné, Chief Executive Officer and President of the Executive Committee, Total, President and Chief Executive Officer.
Innovation & Industry
Future of technology: As technology expands to virtually all aspects of the economy, how does it affect our lives? What good can technology do for the world? And what is the right balance between competition and innovation in the technology industry? Registered participants include Jack Ma Yun, Executive Chairman, Alibaba Group, Marissa Mayer, President and Chief Executive Officer, Yahoo, Satya Nadella¸ Chief Executive Officer, Microsoft Corporation, Sheryl Sandberg, Chief Operating Officer and Member of the Board, Facebook Inc., Eric Schmidt, Executive Chairman, Google, USA, and Jimmy Wales, Founder and Chair Emeritus, Board of Trustees, Wikimedia Foundation.
Society & Security
Income inequality and the development agenda: While many countries are still struggling to reinvigorate growth, the discussion in other countries revolves around the redistribution of wealth. How can we incorporate the needs of developing nations, struggling western economies, and the equality and parity questions? Registered participants include Roberto Azevêdo, Director-General, World Trade Organization (WTO), Bill Gates, Co-Chair, Bill & Melinda Gates Foundation, Melinda Gates, Co-Chair, Bill & Melinda Gates Foundation, Angel Gurría, Secretary-General, Organisation for Economic Co-Operation and Development (OECD), Phumzile Mlambo-Ngcuka, Undersecretary-General and Executive Director, United Nations Entity for Gender Equality and the Empowerment of Women (UN WOMEN), and Guy Ryder, Director-General, International Labour Organization (ILO).
The Co-Chairs of the Annual Meeting 2015 are: Hari S. Bhartia, Co-Chairman and Founder, Jubilant Bhartia Group, India; Winnie Byanyima, Executive Director, Oxfam International, United Kingdom; Katherine Garrett-Cox, Chief Executive Officer and Chief Investment Officer, Alliance Trust, United Kingdom; Young Global Leader Alumnus; Jim Yong Kim, President, The World Bank, Washington DC; Eric Schmidt, Executive Chairman, Google, USA; and Roberto Egydio Setubal, Chief Executive Officer and Vice-Chairman of the Board of Directors, Itaú Unibanco, Brazil.
The World Economic Forum is an international institution committed to improving the state of the world through public-private cooperation in the spirit of global citizenship. It engages with business, political, academic and other leaders of society to shape global, regional and industry agendas.
Incorporated as a not-for-profit foundation in 1971 and headquartered in Geneva, Switzerland, the Forum is independent, impartial and not tied to any interests. It cooperates closely with all leading international organizations (www.weforum.org).
Global Economic Prospects to Improve in 2015, But Divergent Trends Pose Downside Risks, Says WB
WASHINGTON, January 13, 2015 – Following another disappointing year in 2014, developing countries should see an uptick in growth this year, boosted in part by soft oil prices, a stronger U.S. economy, continued low global interest rates, and receding domestic headwinds in several large emerging markets, says the World Bank Group’s Global Economic Prospects (GEP) report, released today.
After growing by an estimated 2.6 percent in 2014, the global economy is projected to expand by 3 percent this year, 3.3 percent in 2016 and 3.2 percent in 2017 [1], predicts the Bank’s twice-yearly flagship. Developing countries grew by 4.4 percent in 2014 and are expected to edge up to 4.8 percent in 2015, strengthening to 5.3 and 5.4 percent in 2016 and 2017, respectively.
“In this uncertain economic environment, developing countries need to judiciously deploy their resources to support social programs with a laser-like focus on the poor and undertake structural reforms that invest in people,” said World Bank Group President Jim Yong Kim. “It’s also critical for countries to remove any unnecessary roadblocks for private sector investment. The private sector is by far the greatest source of jobs and that can lift hundreds of millions of people out of poverty.”
Underneath the fragile global recovery lie increasingly divergent trends with significant implications for global growth. Activity in the United States and the United Kingdom is gathering momentum as labor markets heal and monetary policy remains extremely accommodative. But the recovery has been sputtering in the Euro Area and Japan as legacies of the financial crisis linger. China, meanwhile, is undergoing a carefully managed slowdown with growth slowing to a still-robust 7.1 percent this year (7.4 percent in 2014), 7 percent in 2016 and 6.9 percent in 2017. And the oil price collapse will result in winners and losers.
Risks to the outlook remain tilted to the downside, due to four factors. First is persistently weak global trade. Second is the possibility of financial market volatility as interest rates in major economies rise on varying timelines. Third is the extent to which low oil prices strain balance sheets in oil-producing countries. Fourth is the risk of a prolonged period of stagnation or deflation in the Euro Area or Japan.
“Worryingly, the stalled recovery in some high-income economies and even some middle-income countries may be a symptom of deeper structural malaise,” said Kaushik Basu, World Bank Chief Economist and Senior Vice President. “As population growth has slowed in many countries, the pool of younger workers is smaller, putting strains on productivity. But there are some silver linings behind the clouds. The lower oil price, which is expected to persist through 2015, is lowering inflation worldwide and is likely to delay interest rate hikes in rich countries. This creates a window of opportunity for oil-importing countries, such as China and India; we expect India’s growth to rise to 7 percent by 2016. What is critical is for nations to use this window to usher in fiscal and structural reforms, which can boost long-run growth and inclusive development.”
On the back of gradually recovering labor markets, less budget tightening, soft commodity prices, and still-low financing costs, growth in high-income countries as a group is expected to rise modestly to 2.2 percent this year (from 1.8 percent in 2014) in 2015 and by about 2.3 percent in 2016-17. Growth in the United States is expected to accelerate to 3.2 percent this year (from 2.4 percent last year), before moderating to 3 and 2.4 percent in 2016 and 2017, respectively. In the Euro Area, uncomfortably low inflation could prove to be protracted. The forecast for Euro Area growth is a sluggish 1.1 percent in 2015 (0.8 percent in 2014), rising to 1.6 percent in 2016-17. In Japan, growth will rise to 1.2 percent in 2015 (0.2 percent in 2014) and 1.6 percent in 2016.
Trade flows are likely to remain weak in 2015. Since the global financial crisis, global trade has slowed significantly, growing by less than 4 percent in 2013 and 2014, well below the pre-crisis average growth of 7 percent per annum. The slowdown is partly due to weak demand and to what appears to be lower sensitivity of world trade to changes in global activity, finds analysis in the report. Changes in global value chains and a shifting composition of import demand may have contributed to the decline in responsiveness of trade to growth.
Commodity prices are projected to stay soft in 2015. As discussed in a chapter in the report, the unusually steep decline in oil prices in the second half of 2014 could significantly reduce inflationary pressures and improve current account and fiscal balances in oil-importing developing countries.
“Lower oil prices will lead to sizeable real income shifts from oil-exporting to oil-importing developing countries. For both exporters and importers, low oil prices present an opportunity to undertake reforms that can increase fiscal resources and help broader environmental objectives,” said Ayhan Kose, Director of Development Prospects at the World Bank.
Amongst large middle-income countries that will benefit from lower oil prices is India, where growth is expected to accelerate to 6.4 percent this year (from 5.6 percent in 2014), rising to 7 percent in 2016-17. In Brazil, Indonesia, South Africa and Turkey, the fall in oil prices will help lower inflation and reduce current account deficits, a major source of vulnerability for many of these countries.
However, sustained low oil prices will weaken activity in exporting countries. For example, the Russian economy is projected to contract by 2.9 percent in 2015, getting barely back into positive territory in 2016 with growth expected at 0.1 percent.
In contrast to middle-income countries, economic activity in low-income countries strengthened in 2014 on the back of rising public investment, significant expansion of service sectors, solid harvests, and substantial capital inflows. Growth in low-income countries is expected to remain strong at 6 percent in 2015-17, although the moderation in oil and other commodity prices will hold growth back in commodity exporting low-income countries.
“Risks to the global economy are considerable. Countries with relatively more credible policy frameworks and reform-oriented governments will be in a better position to navigate the challenges of 2015,” concluded Franziska Ohnsorge, Lead Author of the report.
Regional Highlights:
The East Asia and Pacific region continued its gradual adjustment to slower but more balanced growth. Regional growth slipped to 6.9 percent in 2014 as a result of policy tightening and political tensions that offset a rise in exports in line with the ongoing recovery in some high-income economies. The medium-term outlook is for a further easing of growth to 6.7 percent in 2015 and a stable outlook thereafter, reflecting a gradual slowdown in China, which will be offset by a pick-up in the rest of the region in 2016-17. In China, structural reforms, a gradual withdrawal of fiscal stimulus, and continued prudential measures to slow non-bank credit expansion will result in slowing growth to 6.9 percent by 2017 (from 7.4 percent in 2014). In the rest of the region, excluding China, growth will strengthen to 5.5 percent by 2017 (from 4.6 percent in 2014) supported by firming exports, improved political stability, and strengthening investment.
Growth in developing Europe and Central Asia is estimated to have slowed to a lower-than-expected 2.4 percent in 2014 as a sputtering recovery in the Euro Area and stagnation in Russia posed headwinds. In contrast, growth in Turkey exceeded expectations despite slowing to 3.1 percent. Regional growth is expected to rebound to 3 percent in 2015, 3.6 percent in 2016 and 4 percent in 2017 but with considerable divergence. Recession in Russia holds back growth in Commonwealth of Independent States whereas a gradual recovery in the Euro Area should lift growth in Central and Eastern Europe and Turkey. The tensions between Russia and Ukraine and the associated economic sanctions, the possibility of prolonged stagnation in the Euro Area, and sustained commodity price declines remain key downside risks for the region.
Growth in Latin America and the Caribbean slowed markedly to 0.8 percent in 2014, but with diverging developments across the region. South America slowed sharply as domestic factors, exacerbated by economic slowdown in major trading partners and declining global commodity prices, took their toll on some of the largest economies in the region. In contrast, growth in North and Central America was robust, lifted by strengthening activity in the United States. Strengthening exports on the back of the continued recovery among high-income countries and robust capital flows should lift regional GDP growth to an average of around 2.6 percent in 2015-17. A sharper-than-expected slowdown in China and a steeper decline in commodity prices represent major downward risks to the outlook.
Following years of turmoil, some economies in the Middle East and North Africa appear to be stabilizing, although growth remains fragile and uneven. Growth in oil-importing countries was broadly flat in 2014, while activity in oil-exporting countries recovered slightly after contracting in 2013. Fiscal and external imbalances remain significant. Regional growth is expected to pick up gradually to 3.5 percent in 2017 (from 1.2 percent in 2014). Risks from regional turmoil and from the volatile price of oil are considerable; political transitions and security challenges persist. Measures to address long-standing structural challenges have been repeatedly delayed and high unemployment remains a key challenge. Lower oil prices offer an opportunity to remove the region’s heavy energy subsidies in oil-importing countries.
In South Asia, growth rose to an estimated 5.5 percent in 2014 from a 10-year low of 4.9 percent in 2013. The upturn was driven by India, the region’s largest economy, which emerged from two years of modest growth. Regional growth is projected to rise to 6.8 percent by 2017, as reforms ease supply constraints in India, political tensions subside in Pakistan, remittances remain robust in Bangladesh and Nepal, and demand for the region’s exports firms. Past adjustments have reduced vulnerability to financial market volatility. Risks are mainly domestic and of a political nature. Sustaining the pace of reform and maintaining political stability are key to maintaining the recent growth momentum.
In Sub-Saharan Africa, growth picked up only moderately in 2014 to 4.5 percent, reflecting a slowdown in several of the region’s large economies, notably South Africa. Growth is expected to remain flat in 2015 at 4.6 percent (lower than previously expected), largely due to softer commodity prices, and rise gradually to 5.1 percent by 2017, supported by infrastructure investment, increased agriculture production, and buoyant services. The outlook is subject to significant downside risks arising from a renewed spread of the Ebola epidemic, violent insurgencies, lower commodity prices, and volatile global financial conditions. Policy priorities include a need for budget restraint for some countries in the region and a shift of spending to increasingly productive ends, as infrastructure constraints are acute. Project selection and management could be improved with greater transparency and accountability in the use of public resources.
News Corp Acquires BigDecisions.Com – India Web Startup Helps Consumers Make Financial Decisions
New York – News Corp announced today that it has acquired BigDecisions.com in India. BigDecisions.com aims to help Indian consumers make smarter financial decisions through interactive, decision-making tools powered by sophisticated algorithms and data. Its mission is to provide a platform to deliver unbiased information and analysis to consumers on topics ranging from life and health insurance and retirement planning to providing for a child’s education or buying and renting real estate.
“Our latest investment builds on our abiding belief that a digital India needs more trusted, reliable and independent data,” said Robert Thomson, Chief Executive of News Corp. “BigDecisions.com will help Indians make the most important decisions by using accurate information tailored to their personal needs. This platform will be high quality, privacy-protected and easy-to-use.”
The acquisition of BigDecisions.com includes the site’s parent company, FinDirect Services Pvt Ltd.
News Corp’s investment follows its announcement in November that it had acquired a 25% stake in PropTiger.com, a leading residential real estate platform that also provides accurate and independent data and information to India’s homebuyers. News Corp’s other operations in India include Dow Jones, The Wall Street Journal, Factiva and HarperCollins Publishers businesses.
Started in early 2013 by Manish Shah and Gaurav Roy, and operating until recently as bigdecisions.in, the BigDecisions.com platform has already helped some 40,000 users make better-informed decisions. Following the acquisition, both co-founders will help oversee a significant expansion of the Mumbai-based BigDecisions.com team as well as its consumer offerings. They will report to Raju Narisetti, News Corp Senior Vice President, Strategy.
Mr. Shah, an alumnus of IIM Ahmedabad, spent a decade with Citigroup in India and the US, in a wide range of roles in the unsecured lending, wealth management and mortgage businesses. In his last role, he was head of new initiatives with AEGON Religare Life Insurance. Mr Roy is an alumnus of IIT Bombay and XLRI Jamshedpur, with diverse experience across management consulting, financial services and technology. He has worked at Arthur Andersen, KPMG, Wipro, Bharti AXA, and AEGON Religare.
###
About News Corp
News Corp (NASDAQ: NWS, NWSA; ASX: NWS, NWSLV) is a global, diversified media and information services company focused on creating and distributing authoritative and engaging content to consumers throughout the world. The company comprises businesses across a range of media, including: news and information services, book publishing, cable network programming in Australia, digital real estate services, digital education, and pay-TV distribution in Australia. Headquartered in New York, the activities of News Corp are conducted primarily in the United States, Australia, and the United Kingdom. More information: http://www.newscorp.com.
AIG Completes the Acquisition of Ageas Protect, Leading Provider of Life Protection Products
NEW YORK– American International Group, Inc. (NYSE:AIG) today announced the completion of its previously agreed acquisition of Ageas Protect Limited, a leading provider of term life, critical illness, and income protection coverage to over 350,000 consumers in the UK, Channel Islands and Isle of Man. AIG’s agreement to acquire Ageas Protect was announced in August 2014.
AIG has been present in the UK insurance market for over 50 years and is known for its expertise in underwriting, distribution and marketing, as well as for its network of strong commercial relationships.
Ageas Protect is recognised in the industry for product innovation, the effective use of technology and high quality service. AIG believes that the acquisition will enhance its Consumer Insurance business and strengthen its capability in the UK, where it already offers personal accident, health and travel insurance coverage to consumers, as well as customized insurance solutions for high net worth individuals through AIG Private Client Group.
“We are excited by this opportunity to strengthen AIG’s presence in the UK life protection market and look forward to working with the management, employees and distributors who have done such a great job in growing Ageas Protect into a leading market presence in such a short time,” said Kevin Hogan, AIG Chief Executive Officer of Consumer Insurance. “The acquisition of Ageas Protect helps drive the continued expansion of AIG’s Consumer portfolio of insurance solutions designed to meet consumer needs for financial and retirement security. By building on shared values such as product innovation and service excellence, we will ensure that AIG becomes the most valued insurer to even more consumers in the UK and everywhere we do business.”
American International Group, Inc. (AIG) is a leading international insurance organization serving customers in more than 130 countries. AIG companies serve commercial, institutional, and individual customers through one of the most extensive worldwide property-casualty networks of any insurer. In addition, AIG companies are leading providers of life insurance and retirement services in the United States. AIG common stock is listed on the New York Stock Exchange and the Tokyo Stock Exchange.
Additional information about AIG can be found at www.aig.com | YouTube: www.youtube.com/aig | Twitter: @AIG_LatestNews | LinkedIn: http://www.linkedin.com/company/aig
AIG is the marketing name for the worldwide property-casualty, life and retirement, and general insurance operations of American International Group, Inc. For additional information, please visit our website at www.aig.com. All products and services are written or provided by subsidiaries or affiliates of American International Group, Inc. Products or services may not be available in all countries, and coverage is subject to actual policy language. Non-insurance products and services may be provided by independent third parties. Certain property-casualty coverages may be provided by a surplus lines insurer. Surplus lines insurers do not generally participate in state guaranty funds, and insureds are therefore not protected by such funds.
Another Strong Year for Freddie Mac Multifamily Securities
MCLEAN, VA- – Freddie Mac (OTCQB: FMCC) Multifamily further reduced taxpayer risk in 2014 by selling the overwhelming majority of credit risk on the mortgages it purchased to private capital investors through its Multifamily K-Deal securitization program. There were 21 Multifamily securities offerings in 2014 for a total transactions volume of $22.4 billion which, in addition to K-Deals, included a small volume of other securities, including the company’s Q- and M-Deals.
2014 Highlights:
Continued to support affordable rental housing through securitization. Approximately 90 percent of the apartment units Freddie Mac finances are affordable to households earning up to the area median income, and most of those loans are securitized.
Issued $21.3 billion in K-Deals in 2014 and securitized almost $93 billion in multifamily loans since the program started in 2009, backing approximately $79 billion in guaranteed certificates and $13.5 billion in unguaranteed certificates.
Introduced and issued $189 million in Q Certificates that are backed by $215 million in multifamily loans not underwritten by Freddie Mac at the time of origination but that meet the company’s current underwriting standards. Q Certificates were introduced this fall.
Issued $683 million in M Certificates backed by $747 million in multifamily loans. M Certificates are fully guaranteed tax-exempt and taxable securities supported by pools of unenhanced tax-exempt and taxable multifamily housing collateral.
Grew the private investor base to more than 140 domestic and international investors. Typical investors are life insurance companies, banks, pension funds, money managers and hedge funds, some of whom assume first loss positions, reducing taxpayer risk.
Inclusion of K-Deals in the Barclays U.S. Aggregate and Global Aggregate bond indices in June.
Quotes from Mitchell Resnick, vice president of Freddie Mac Multifamily Capital Markets:
“The K-Deal program has become the benchmark for Agency CMBS. 2014 was our second largest year for securities issuance and we now have just short of $100 billion in K Certificates outstanding. This year we also issued Q and M Certificates, adding variety to the investment opportunities for our customers. Part of the reason for our success is the exceptional credit performance of our collateral. At the end of the year, total K-Deal delinquencies amounted to 1 basis point.”
“The multifamily market is healthy and we expect to issue approximately $25 billion in multifamily securities across 17 to 20 K-Deals next year. Also, in 2015 we expect to introduce a few new types of collateral to our securitizations, including 10-year floaters and small balance loans.”
This announcement is not an offer to sell any Freddie Mac securities. Offers for any given security are made only through applicable offering circulars and related supplements, which incorporate Freddie Mac’s Annual Report on Form 10-K for the year ended December 31, 2013, filed with the Securities and Exchange Commission (SEC) on February 27, 2014; all other reports Freddie Mac filed with the SEC pursuant to Section 13(a) of the Securities Exchange Act of 1934 (Exchange Act) since December 31, 2013, excluding any information “furnished” to the SEC on Form 8-K; and all documents that Freddie Mac files with the SEC pursuant to Sections 13(a), 13(c) or 14 of the Exchange Act, excluding any information furnished to the SEC on Form 8-K.
Investors Should Prepare for a Lower Return Environment Relative to Historic Returns – Prudential Experts:
NEW YORK, – Prudential market experts expect moderate growth in 2015 – led by the United States – as global economies continue to recover. Outlining their views today at Prudential Financial, Inc.’s (NYSE:PRU) 2015 Global Economic and Retirement Outlook discussion, they said any growth is likely to be uneven across the globe and in the face of increased and prolonged volatility.
Ed Keon, managing director of QMA, said the current environment will lead to continued low yields for bonds and yet another strong year for the stock market.
“Bond yields have stayed low after the end of quantitative easing for a simple reason: bond demand is very strong, and bond supply is modest. Strong demand and modest supply means high prices in any market, and leads to low yields for bonds,” Keon said. “In the short run, stocks can continue to perform well as low interest rates support higher than normal valuations, but higher valuations carry a long-term cost. Eventually expected returns of stock and bond portfolios might be lower than historical norms, creating challenges for many investors.”
Mike Lillard, chief investment officer of Prudential Fixed Income, agrees that the outlook for stocks is more attractive than for bonds. Lillard also believes interest rates will remain low with the health of the economy weighing heavily on any Federal Reserve decisions.
“June would be my liftoff date for a rate hike from the Fed, but they will do it very slowly and patiently. If the economy begins to soften, however, they will stop to avoid sending us into another recession,” said Lillard. “They are going to be highly data dependent, and at the end of the day, our expectation is that they won’t be able to get short term rates very high.”
Quincy Krosby, a Prudential market strategist, warned that the recent slide in oil may not be as beneficial as Fed members make it out to be. She also questions whether a rate hike by the Fed could ultimately harm the economy.
“While consumer spending may have increased in the United States, the Fed needs to worry more about what lower energy prices mean globally. It could be signaling a decrease in demand in places like China, Europe, and Japan, which could lead to decreased production and job cuts in the energy sector,” said Krosby. “Taking that into account, the Fed also has to keep in mind that when rates rise, something always breaks. There’s no telling what asset class may start the ball rolling, but it can’t come as a surprise. That said, it has been the velocity of the oil price plunge that caught markets off guard. Consumers, however, are net beneficiaries of lower prices.”
John Praveen, chief investment strategist for Prudential International Investments, cautioned that divergent monetary policies from central banks are likely to lead to volatility in the coming year and that current and future geopolitical risk cannot be dismissed.
“The start of quantitative easing in Europe and possibly Japan will allow for greater expansion in those markets compared to the United States, yet any unforeseen risks could derail that proposition,” Praveen said. “Europe was supposed to be on an upswing in 2014, but Putin’s actions held any potential rally in check. With such interconnected global economies, any geopolitical or major risk can hold everything back.”
Sri Reddy, head of full service investments with Prudential Retirement, recognizes that this low growth environment described by Prudential’s market experts will challenge investors to think creatively when it comes to retirement income and will cause a shift in how retirement products are structured.
“This prolonged low interest rate and low growth economy has investors looking for new options to generate retirement income,” Reddy said. “Things like automatic enrollment plans, auto escalation options, and enhanced defined contribution plans need to become more of an industry norm to secure retirement income for today’s workers. With people living longer than ever before, the industry needs to continue to adjust.”
For journalists interested in talking to these experts, please call Prudential Global Communications at 973-802-9829.
Prudential Financial, Inc. (NYSE:PRU), a financial services leader with more than $1 trillion of assets under management as of September 30, 2014, has operations in the United States, Asia, Europe, and Latin America. Prudential’s diverse and talented employees are committed to helping individual and institutional customers grow and protect their wealth through a variety of products and services, including life insurance, annuities, retirement-related services, mutual funds and investment management. In the U.S., Prudential’s iconic Rock symbol has stood for strength, stability, expertise and innovation for more than a century. For more information, please visit www.news.prudential.com.
Americans Optimistic About the Economy, Finances and the Future
Americans will ring in the new year feeling optimistic about the economy, their personal financial situation and the future of the economy, according to the second installment of the Wells Fargo & Company (NYSE: WFC) “How America Buys and Borrows” survey.
More than three-quarters of Americans (78 percent) expect the economy to stay the same or improve and 81 percent believe their current personal situation is stable or improving. This optimism is reflected in similar levels across all generations, along with an overall desire to learn more about money management with fewer than half (43 percent) of respondents saying they know enough.
“Often when we talk about generations, we talk about how different they are,” said Gary Korotzer, executive vice president with Wells Fargo’s Consumer Credit Solutions group. “What we see in this survey is remarkably similar levels of optimism across the generations, led slightly by Millennials, and a united desire to continue learning how to be better money managers.”
When asked about their view on the current state of the economy, 79 percent of Millennials (ages 18 to 32) say it is stable to strong, which is in line with the 75 percent of Generation X (ages 33 to 48) and 70 percent of Boomers (ages 49 to 65) who say the same thing. In addition, when asked about their expectations for the future of the economy, 85 percent of Millennials expect it to stay the same or get better, which is similar to the 80 percent of Generation X and 74 percent of Boomers with the same perception.
When it comes to personal financial situations, 84 percent of Millennial respondents characterize theirs as stable to strong, similar to the 81 percent of Generation X and 78 percent of Boomers who say the same. Looking ahead, 94 percent of Millennials say they expect their personal financial situations to stay the same or get better with 92 percent of Generation X and 86 percent of Boomers feeling the same way.
Optimism also encompassed the topic of homeownership, with 71 percent of respondents saying they envision being homeowners five years from now.
“These levels of optimism are heartening, as is the desire to continue learning the skills needed to make these positive outcomes a reality,” added Korotzer. “More than three-quarters of respondents said they have an appetite to learn even more, which is encouraging because understanding how to manage money is the foundation of financial stability and success.”
The survey also revealed:
Millennials are most interested in increasing their financial know-how, with 38 percent reporting a desire to learn more – compared to 29 percent of Generation X and 30 percent of Boomers.
In particular, more than half of respondents (56 percent) say they would like to learn more about managing their money, 4 in 10 feel more knowledge would increase their confidence in decision-making and 4 in 10 aren’t fully confident they know enough to make good decisions about borrowing.
According to the survey, when respondents graded their understanding and management of money:
33 percent grade their understanding of personal finances a C, D or F
39 percent grade their understanding of how credit scores work a C, D or F
43 percent grade their understanding of credit and loan products a C, D or F
43 percent grade their understanding of what banks consider when approving a credit product or loan a C, D or F
75 percent of respondents say having a good credit score is important, yet only 54 percent say they are proud of their credit score and 37 percent are concerned about their credit score.
56 percent believe a person’s credit rating is a reflection of how responsible they are with money and 45 percent regularly monitor their credit report.
Half of respondents agree that having some debt is normal. However, one-third say they live debt-free, half say they do not carry a credit card balance and half save for major purchases instead of relying on credit.
Consumers are improving their financial situations. For example:
38 percent report having less debt now than they did two years ago – a slight increase over the 36 percent of respondents saying the same in last year’s survey.
38 percent say that if they lost their jobs, they would be able to get by for at least a few months. In last year’s survey, only 32 percent of respondents indicated this level of preparedness.
31 percent of respondents are saving more today than they were five years ago. In 2013, only 28 percent of respondents responded similarly.
27 percent feel prepared for unexpected expenses and emergencies. In 2013, only 21 percent of respondents felt prepared.
Most respondents (81 percent) reported the need to plan for significant expenses in the next couple of years. The most common expenses mentioned were travel (35 percent), taxes (35 percent) and home improvement (30 percent).
Most prefer to fund their significant expenses with cash savings, instead of credit. Exceptions: specific-purpose loans such as a mortgage, auto, or student and personal loans for the purpose of debt consolidation.
Most feel that there are different kinds of debt, with 52 percent of respondents saying owing money on a mortgage is not the same as owing money on other types of purchases.
Millennials are more likely than older consumers to consider a student loan an investment.
On average, respondents believe their current homes to be worth $311,000 and owe $151,000 on their homes.
Free Tools
Understanding how to responsibly manage finances and credit are important steps to building (or improving) and maintaining a sound financial future. To help its customers succeed financially through life’s various stages, Wells Fargo offers the following complimentary tools:
My Financial Guide, which features articles and videos about money management.
Hands on Banking®, an interactive financial education program for all age groups (available in Spanish at www.elfuturoentusmanos.com).
Wells Fargo’s new Path to Credit video series, designed to illustrate why credit, and understanding it, is important to everyday life.
My FirstHome online, which helps first-time and ready-again buyers prepare for homeownership.
Get College ReadySM, an interactive platform for parents and college-bound students offering free resources and tools to help guide students’ transition into college.
About the How America Buys and Borrows survey
On behalf of Wells Fargo, Ipsos surveyed more than 3,000 American adults ages 18 to 65 in June 2014 online to understand attitudes and perceptions of current economy and personal financial situations. Weighting on age, gender, education, diverse segments and income was applied to the results to achieve a nationally representative population. The “How America Buys and Borrows” survey was first conducted in 2013 and will be conducted annually.
About Wells Fargo
Wells Fargo & Company (NYSE: WFC) is a nationwide, diversified, community-based financial services company with $1.6 trillion in assets. Founded in 1852 and headquartered in San Francisco, Wells Fargo provides banking, insurance, investments, mortgage, and consumer and commercial finance through more than 8,700 locations, 12,500 ATMs, and the internet (wellsfargo.com), and has offices in 36 countries to support customers who conduct business in the global economy. With approximately 265,000 team members, Wells Fargo serves one in three households in the United States. Wells Fargo & Company was ranked No. 29 on Fortune’s 2014 rankings of America’s largest corporations. Wells Fargo’s vision is to satisfy all our customers’ financial needs and help them succeed financially. Wells Fargo perspectives are also available at Wells Fargo Blogs and Wells Fargo Stories.
Bank of England announces results of UK stress test
The Bank of England today announced the results of the first concurrent stress testing exercise of the UK banking system. Alongside the stress test publication, the Bank of England also published its Financial Stability Report, which sets out the Financial Policy Committee’s (FPC) assessment of the outlook for the stability and resilience of the financial sector, and the Systemic Risk Survey, which quantifies and tracks market participants’ perceptions of systemic risks.
Following on from the EU-wide stress test, the 2014 UK stress test of the eight major UK banks and building societies was designed specifically to assess their resilience to a very severe housing market shock and to a sharp rise or snap back in interest rates. This was not a forecast or expectation by the Bank of England regarding the likelihood of a set of events materialising, but a coherent, severe ‘tail risk’ scenario.
The eight banks and building societies tested as part of this exercise were Barclays Bank, Co-operative Bank, HSBC Bank, Lloyds Banking Group, Nationwide Building Society, Royal Bank of Scotland, Santander UK and Standard Chartered.
There was substantial variation across the banks and building societies in terms of the impact of the stress scenario. From an individual-institution perspective, the Prudential Regulation Authority (PRA) Board judged that this stress test did not reveal capital inadequacies for five out of the eight participating banks, given their balance sheets at end-2013 (Barclays, HSBC, Nationwide, Santander UK and Standard Chartered). The PRA Board did not require these banks to submit revised capital plans.
Following the stress testing exercise, the PRA Board judged that, as at end-2013, three of the eight participating banks (Co-operative Bank, Lloyds Banking Group and Royal Bank of Scotland) needed to strengthen their capital position further. But, given continuing improvements to banks’ resilience over the course of 2014 and concrete plans to build capital further going forward, only one of these banks (Co-operative Bank) was required to submit a revised capital plan.
The FPC considered the information provided by the stress-test results from the perspective of the resilience of the UK banking system as a whole. The FPC noted that only one bank fell below the 4.5% threshold at the trough of the stress scenario, that the capitalisation of the system had improved further over the course of 2014 and that the PRA Board had agreed plans with banks to build capital further. Overall, the FPC judged that the resilience of the system had improved significantly since the capital shortfall exercise in 2013. Moreover, the stress-test results and banks’ capital plans, taken together, indicated that the banking system would have the capacity to maintain its core functions in a stress scenario. Therefore, the FPC judged that no system-wide, macroprudential actions were needed in response to the stress test.
Mark Carney, Governor of the Bank of England, said:
“The stress test completes our capital framework by informing judgments about the appropriate size of capital buffers for individual firms and for the system as a whole. It is a major component of both our macro- and micro-prudential regimes. As a joint exercise between the PRA and FPC, it demonstrates the major synergies possible across the Bank of England. This was a demanding test. The results show that the core of the banking system is significantly more resilient, that it has the strength to continue to serve the real economy even in a severe stress, and that the growing confidence in the system is merited.”
Capital One Expands Portfolio Analysis Tools Enabling Investors to Access International Exchanges,
SEATTLE, In its ongoing quest to empower self-directed investors, Capital One ShareBuilder has introduced a selection of new tools designed to help investors research securities and better understand their investments.
“As we approach the New Year, now is a great time for investors to review their portfolio holdings and performance, and determine if their current allocation aligns to their long-term goals,” said Dan Greenshields, president of Capital One ShareBuilder. “Self-directed investors are looking to build a sound investing strategy, and these new tools may help them keep track of their investments and better understand the outcomes of their investing decisions as markets and personal circumstances change.”
ShareBuilder’s new Portfolio Allocation and Performance tools are designed to educate investors on strategic asset allocation and the relationship between allocation and return. The What If I Had Invested tool allows investors to determine how a theoretical investment would have performed.
Portfolio Allocation breaks down a portfolio by asset class, market cap and security. This tool may help investors better understand the level of diversification among their asset classes, and determine if they have enough exposure to various asset classes.
Performance provides a transparent overview of each account’s overall performance, highlighting time-weighted returns for specific periods of time. This tool offers investors greater transparency and a clear understanding of gains and losses amongst their investments.
Using What If I Had Invested, investors can learn how a U.S.-listed stock investment may or may not have paid off (had they actually made the investment). Performance is broken down by total gains and losses, total market value, total transaction fees and annualized and cumulative returns, offering investors insights into specific equities’ historical performance.
Capital One ShareBuilder also introduced a new Global Markets research and trading tool available on its iPad tablet app, enabling investors to track 19 major global exchanges (three domestic and 16 international) and research the indexes, ETFs, mutual funds and equities that provide exposure to each country or region. Investors can track performance and make trades from their iPad.
“Today investors are increasingly aware of international markets, and we’ve seen immense interest in well-known international equities like the Chinese e-commerce site Alibaba. We’re also experiencing strong growth in mobile trading, with nearly one-quarter of our trades now being made via mobile device,” said Greenshields.
Showcased below, the Global Markets iPad tablet app allows investors to explore a virtual globe to assess the performance of various indexes over time and research securities within each index, as well.
Global Markets
For full information on each of these products, visit www.sharebuilder.com.
About Capital One ShareBuilder
Capital One ShareBuilder is a leading online investing site for investors who have long-term financial goals and want to say goodbye to investing complexity. Whether you’re a seasoned investor or just getting started, ShareBuilder by Capital One has tools and resources to help Americans plan their financial futures. No minimum balance required when you open an account and pay low commissions when investing. Trade when you want, any amount you want, and what you want — stocks, exchange-traded funds, mutual funds, options and retirement tools.
Wells Fargo Launches Private Student Loan Modification Program Will Assist Financially Distressed Student Customers
As the nation’s largest private student lender among U.S. banks, Wells Fargo today announced its new private student loan modification program (PSLM) to assist customers experiencing financial hardship or distress.
Through the program, Wells Fargo private student loan customers experiencing a hardship will have their financial situation reviewed on an individual case-by-case basis to determine eligibility for a short- or long-term loan modification, as appropriate. If eligible, Wells Fargo will lower the customer’s interest rate to achieve a student loan payment that is determined to be affordable based on the customer’s income level.
“The private student loan modification program demonstrates our commitment to helping our customers achieve financial stability and success,” said John Rasmussen, head of Wells Fargo’s Education Financial Services. “We remain focused on providing a broad range of resources and programs to assist individuals in financing their dreams of higher education.”
When a Wells Fargo private student loan customer’s financial situation is preliminarily assessed by a PSLM representative, and the hardship qualifies the customer for the program, Wells Fargo will work with the customer to gather supporting financial documents that may include paystubs, or other types of income documentation, along with information surrounding the customer’s complete financial picture to evaluate the severity of the financial hardship. Once documentation is received and the customer is approved for the PSLM program, the customer will receive a loan modification agreement by overnight mail delivery, which the customer signs and returns.
Wells Fargo customers who are experiencing a severe financial hardship should visit https://www.wellsfargo.com/student/repay/ or call 1-800-378-5526 to learn more about the options to successfully repay a Wells Fargo private student loan, including what to do in cases of hardship or emergency.
In addition to the PSLM program, Wells Fargo offers free online resources to help customers prepare, plan, and finance their higher education, which include: 5 Steps to Financial Aid; Student LoanDown Blog; Wells Fargo Community; CollegeSTEPS; CollegeSTEPS Magazine (PDF)*; Campus Countdown; Private Student Loan Calculator; and Get College Ready.
Since entering the student loan marketplace in 1968, Wells Fargo continues to manage one of the most successful financial portfolios in the private student loan marketplace as a result of prudent underwriting and providing quality, timely information, transparency, and service for each of its 1.3 million customers.
About Wells Fargo Education Financial Services
Wells Fargo Education Financial Services has been in the student lending business since 1968 and currently serves 1.3 million student, parent and family customers in all 50 states. Wells Fargo provides private student loans directly to consumers, through the Internet and at more than 6,000 Wells Fargo banking stores to help customers finance their education. Wells Fargo Education Financial Services also provides customers with tools to help them succeed financially while in school and prepare them for when they finish college. Through the Wells Fargo Foundation, we partner with nonprofit organizations and stakeholders to strengthen our goal of providing high quality assistance to those individuals who are working to achieve their educational dreams. Learn more about Wells Fargo Education Financial Services.
About Wells Fargo
Wells Fargo & Company (NYSE: WFC) is a nationwide, diversified, community-based financial services company with $1.6 trillion in assets. Founded in 1852 and headquartered in San Francisco, Wells Fargo provides banking, insurance, investments, mortgage, and consumer and commercial finance through more than 8,700 locations, 12,500 ATMs, and the internet (wellsfargo.com), and has offices in 36 countries to support customers who conduct business in the global economy. With approximately 265,000 team members, Wells Fargo serves one in three households in the United States. Wells Fargo & Company was ranked No. 29 on Fortune’s 2014 rankings of America’s largest corporations. Wells Fargo’s vision is to satisfy all our customers’ financial needs and help them succeed financially. Wells Fargo perspectives are also available at Wells Fargo Blogs and Wells Fargo Stories.
Fannie Mae Taps Reinsurance Industry in New Risk Sharing Transaction
WASHINGTON, DC – Fannie Mae (FNMA/OTC) announced today that it has completed a new credit risk sharing transaction that further diversifies its counterparty exposure and reduces taxpayer risk by increasing the role of private capital in the mortgage market. The credit insurance risk transfer (CIRT™) deal shifts credit risk on a pool of loans to a panel of domestic reinsurers. The CIRT deal also furthers the 2014 Conservatorship Scorecard goal to complete a variety of credit risk sharing transactions in addition to the company’s Connecticut Avenue Securities (CAS) series.
“This unique transaction uses actual losses to calculate benefits, for which risk investors have expressed a preference,” said Andrew Bon Salle, Executive Vice President, Single-Family Underwriting, Pricing and Capital Markets. “This deal complements our current risk sharing offerings focused on capital markets investors and mortgage insurers, and we expect it will be a template for similar transactions that we may execute in the future. The reinsurance market is an attractive potential source of private capital because it currently bears a small amount of U.S. residential mortgage risk. We are pleased to test new and innovative ways to diversify our risk sharing counterparties and to structure this deal in a manner that promotes efficiency and safety.”
In this transaction, CIRT-2014-1 which became effective November 1, 2014, Fannie Mae retains risk on the first 50 basis points of loss on a $6.419 billion pool of loans. If this layer is exhausted, Fannie Mae is provided actual loss coverage for the next 300 basis points of loss on the $6.419 billion pool, up to a maximum coverage of approximately $193 million. The coverage term is 10 years. Depending upon the pay down of the pool and the amount of covered loans that may become seriously delinquent, the aggregate coverage amount may be reduced at the 3-year, 5-year and 7-year anniversaries from the effective date.
The reference loan pool for the transaction consists of 30-year fixed rate loans with loan-to-value (LTV) ratios between 60 and 95 percent. The loans were acquired by Fannie Mae from January through March of 2014. Loans over 80 percent LTV are already covered by primary mortgage insurance, and this credit risk transfer provides supplemental coverage for losses that exceed that covered by primary mortgage insurance.
Fannie Mae’s Credit Risk Sharing initiatives aim to reduce our mortgage default (credit) risk by offering new opportunities for financial institutions to invest in the credit performance of our single-family book of business.
Credit Risk Sharing:
Provides an additional avenue for sharing our mortgage credit risk.
Adds a layer of defense against loss to existing credit risk policies and processes.
Seeks to reduce the government’s participation in the mortgage market.
Benefits:
Enhances our ability to manage credit risk.
Allows us to share credit risk on our guaranty book of business with private market participants.
Reduces taxpayers’ credit risk exposure on Fannie Mae’s guaranty business.
Fulfills our public policy goal to re-start private investment in mortgage credit risk and aligns with objectives set forth in FHFA’s 2013 Conservatorship Scorecard.
Our goal is to develop multiple forms of risk-sharing with private market participants. Below are examples of transactions we are using to share credit risk.
Connecticut Avenue Securities are designed to share credit risk on a portion of our strongest performing single-family book—newly-originated, qualifying mortgage loans that are underwritten using strict credit standards and enhanced risk controls (implemented post housing crisis). Fannie Mae’s first credit-linked debt offering was priced on October 15, 2013. The Connecticut Avenue Securities program aims to offer ongoing investment opportunities that are scalable, and flexible enough to respond to market feedback, and are designed to have minimal, if any, impact on the To Be Announced (TBA) market.
An agreement with National Mortgage Insurance Corp. (National MI) to insure a pool of loans with an unpaid principal balance of over $5 billion was executed on July 15, 2013. This transaction entailed using a pool mortgage insurance policy to transfer a portion of the risk on a pool of high quality loans that Fannie Mae acquired in the fourth quarter of 2012. Read more information on the NMI transaction.
Credit insurance risk sharing deals shift credit risk on a pool of loans to an insurance provider who then transfers that risk to one or more reinsurers. The reinsurance market is a significant and attractive potential source of private capital because it currently bears a small amount of U.S. residential mortgage risk and its other forms of risk are not correlated to Fannie Mae’s to any meaningful degree
Bullish On Stocks, Dollar, Volatility And Real Estate Opportunities – 2015 Market Outlook By BofA Merrill Lynch
BofA Merrill Lynch Global Research today released its outlook for the markets in 2015, forecasting that the bull market in global equities will continue next year but returns will slow to single-digit rates. Strong fundamentals and healthy growth in the U.S. economy support a case for investor optimism and opportunism; however, in the lower-return, higher-volatility environment projected ahead, selective allocation and defensive portfolio moves will be crucial for performance.
At the annual BofA Merrill Lynch Year Ahead Outlook news conferences held today in New York and London, analysts from the Institutional Investor magazine top-ranked global research firm summarized their outlook for the U.S. and global economies as cautiously optimistic.
“While our key measures suggest that the bull market in equities can continue, the sentiment is far from euphoric,” said Candace Browning, head of BofA Merrill Lynch Global Research. “The world appears to be under-allocated to stocks, and we believe we are still only a third of the way into the Great Rotation from bonds. In the U.S., we are maintaining our long-term sector weightings with no changes from 2014, as many of the macroeconomic expectations last year have been delayed. In the current environment, now is the time for investors to be highly selective and make tactical moves to position portfolios for more thematic investing in a transforming world.”
Robust U.S. economic growth continues to outpace the rest of the world, boding well for U.S. employment, wages and housing in 2015. Core inflation is expected to remain steady, and as the new year begins, confidence is high, oil prices are low, the dollar is strong and Washington is relatively calm. As stocks near fair value, sentiment among the research team shifts from extremely bullish to slightly bullish. In the second half of the year, the U.S. Federal Reserve will begin slowly hiking interest rates and investors can anticipate three key changes: lower liquidity, wider credit spreads and higher volatility.
Against this backdrop is moderately accelerating global growth, offset by the very real threat of deflation outside the U.S., particularly in Europe. The BofA Merrill Lynch Global Research team made the following 10 macro calls for the year ahead.
The Standard and Poor’s 500 Index expected to rise to 2200. While we believe the era of excess returns and excessively low volatility is in the past, the secular bull market in stocks should continue. Expected gains in the year ahead imply a price return of approximately 6 percent, in line with an anticipated modest deceleration in earnings growth.
U.S. and global economic growth accelerating. The U.S. economy should continue to grow with household and corporate balance sheets nearly fully recovered and with more stable Federal and state and local fiscal policy In 2015, U.S. GDP growth is projected at 3.3 percent, with global real GDP growth of 3.7 percent (up from 3.2 percent in 2014) and Euro Area GDP growth of 1.2 percent.
Moderate emerging market acceleration. Economic growth in emerging markets should reach 4.5 percent next year, up slightly from a disappointing 4.2 percent in 2014 (but below the consensus call of 4.8 percent). The improvement should be driven by stronger U.S. growth, lower energy prices and cyclical rebounds in a few large economies like Brazil and India.
Inflation, disinflation and deflation. Low inflation is driving policies in every country. Core inflation in the U.S. is expected to remain steady at about 1.5 percent, well below the Federal Reserve’s 2 percent target. Meanwhile, the global backdrop is disinflationary. In 2015, we expect Japan to focus on ending deflation, while Europe faces a major threat of outright deflation, which if it occurs, could trigger another debt crisis.
Commodities face near-term headwinds. Moving into 2015, we see downside risks to energy prices on the back of OPEC’s decision to allow the market to “stabilize itself.” This could result in lower oil prices but also higher price volatility. Our Brent crude oil forecast is reduced for an average of $77 per barrel, and our WTI forecast is reduced to $72 per barrel in 2015. The combination of a strong U.S. dollar, higher interest rates and relatively subdued growth should keep other commodity prices in check in 2015. Even then, we expect base metals to perform relatively well on falling inventories, particularly aluminum and zinc, though copper is less certain. Lastly, gold prices potentially could fall to $1,100 per ounce.
Global rates and currencies: liquidity transfusion. The U.S. dollar should remain strong in 2015 as the U.S. economy outperforms and the Fed moves to the exit. Rates outside the U.S. are expected to remain low, or even decline, with the five-year German government bond yield potentially falling to zero and the euro/U.S. dollar and U.S. dollar/yen reaching 1.20 and 1.23, respectively, by the end of 2015.
Credit markets under pressure. We expect next year to bring an end to an unprecedented five-year reach for yield trade as investment grade credit spreads widen to 140 basis points with total returns close to zero. A paradigm shift in U.S. high-yield outlook should occur in 2015 with returns in the low single-digit range, as investors demand a higher premium for liquidity. Defaults should rise moderately to about 2.0-2.5 percent. IG and HY Issuance is expected to decline by 10-15 percent next year on less refinancing activity.
Global fixed income: a call for quality. The story of 2015 may be outflows for both retail and institutional investors in the U.S. and wider investment-grade spreads. U.S. investment-grade bonds could see a total return of zero. Meanwhile, investment grade in emerging markets should return 2.4 percent; in Europe, 1.5 percent to 2 percent; and in Asia, 1.4 percent. Total returns for high yield could finish around 6 percent in Asia and the emerging markets, around 5 percent in Europe and 2-3 percent in the U.S.
Hope springs eternal for U.S. housing market. New home sales are picking up to more normal levels, rising 18 percent in 2015 and 13 percent in 2016 from extreme lows. Existing home sales should increase by a more moderate 5 percent in 2015 and 3.2 percent in 2016, while home price appreciation continues to slow.
U.S. energy boom set to slow. Total U.S. energy production continues to be driven by substantial shale production; however, most shale oil projects generate very little free cash flow, which means that output is highly price-sensitive. The steep price drop will impact operations of small, levered shale producers. Thus we see U.S. shale oil output growth dropping down to half of this year’s levels. In 2015, we expect natural gas prices to average $3.90 per million British thermal units, driven by continued strong domestic production growth of 3.1 billion cubic feet per day and a drop in weather-sensitive demand. Both the U.S. natural gas and thermal coal markets are expected to remain weak throughout 2015, in our view, and liquid natural gas should enter a bear market.
BofA Merrill Lynch Global Research
The BofA Merrill Lynch Global Research franchise covers nearly 3,400 stocks and 1,100 credits globally and ranks in the top tier in many external surveys. Most recently, the group was named Top Global Research Firm of 2013 by Institutional Investor magazine; No. 1 in the 2014 Institutional Investor All-Europe survey; No. 1 in the 2014 Institutional Investor All-Asia survey for the fourth consecutive year; No. 1 in the Institutional Investor 2014 Emerging EMEA Survey; No. 2 in the 2014 Institutional Investor All-America survey; and No. 2 in the 2013 All-China survey. The group was also named No. 2 in the 2014 Institutional Investor All-Europe Fixed Income Research survey; and No. 2 in the 2014 All-America Fixed Income survey for the third consecutive year.
Bank of America
Bank of America is one of the world’s largest financial institutions, serving individual consumers, small businesses, middle-market businesses and large corporations with a full range of banking, investing, asset management and other financial and risk management products and services. The company provides unmatched convenience in the United States, serving approximately 48 million consumer and small business relationships with approximately 4,900 retail banking offices and approximately 15,700 ATMs and award-winning online banking with 31 million active users and more than 16 million mobile users. Bank of America is among the world’s leading wealth management companies and is a global leader in corporate and investment banking and trading across a broad range of asset classes, serving corporations, governments, institutions and individuals around the world. Bank of America offers industry-leading support to approximately 3 million small business owners through a suite of innovative, easy-to-use online products and services. The company serves clients through operations in more than 40 countries. Bank of America Corporation stock (NYSE: BAC) is listed on the New York Stock Exchange.
Moody’s Asia Pacific Credit Outlook Stable In 2015, Despite Global And Regional Challenges
Singapore, — Moody’s Investors Service says that the credit quality of Moody’s-rated sovereigns, financial institutions and corporates across Asia Pacific will be stable in 2015, owing to a modest recovery in external demand — especially from the US — supportive global monetary conditions, and the region’s fundamental strengths and defenses against external shocks.
“Governments, financial institutions and the vast majority of corporates that we rate will be resilient if, as we expect, global liquidity conditions become less accommodative next year, and China’s economic rebalancing continues,” says Michael Taylor, a Moody’s Managing Director and Chief Credit Officer for Asia Pacific.
“In addition, there will only be a moderation and not a major disruption to capital inflows to Asia Pacific in 2015, with offshore borrowing costs likely to remain well below historical norms,” says Rahul Ghosh, a Moody’s Vice President and Senior Research Analyst.
Moody’s conclusions are contained in its just-released report co-authored by Taylor and Ghosh and titled Asia Pacific Credit Outlook: Stable Credit Quality in 2015 Despite Global and Regional Challenges.
Moody’s report says that rising domestic demand in the US, underpinned by improving growth, will benefit Asian exporters. By contrast, the growth prospects in Japan will be weighed down by structural impediments such as public sector debt overhangs, labour market rigidities and intensifying demographic pressures.
As for China’s continued economic rebalancing, Moody’s report says that while China’s GDP growth is slowing, the authorities’ ability to support economic activity when required will prevent an abrupt fall in growth, and a significant worsening of credit quality for the vast majority of Moody’s-rated issuers.
Moody’s believes there will be a sustained but measured slowdown in Chinese economic activity in 2015, with real GDP growth of 6.5%-7.5%.
However, Moody’s points out that the sustained slowdown of growth in China and economic rebalancing will continue to pose credit challenges for several sectors in the domestic economy.
Weaker companies in the mining and steel sectors in China are vulnerable to slower Chinese GDP growth in 2015, given subdued demand levels, overcapacity issues within the two industries, and the increasingly restricted access to bank and shadow bank financing.
Moody’s report also says that while persistent weakness in global commodity prices will continue to present serious credit challenges to raw material producers in Asia Pacific, the region’s status as a net oil importer, and the opportunity for governments to pare back subsidies, means that falling crude prices will be credit positive for much of the region.
Moody’s report further points out that 19 of the 22 sovereigns rated by Moody’s in Asia Pacific carry stable outlooks; indicating Moody’s expectation of steady credit conditions in 2015.
Moody’s outlook for the region’s banking system is also broadly stable, with 10 stable, one positive, and five negative outlooks.
As for corporates and project and infrastructure finance issuers, 82% carry stable outlooks.
Structural reforms can help poorest countries break ‘vicious’ economic circle – new UN report
The world’s poorest countries are trapped in an economic vicious circle, which pins them in poverty and must be reversed if new development goals are to be met, according to a newly released report from United Nations Conference on Trade and Development (UNCTAD).
The Least Developed Countries Report 2014 argues that those nations, known as “LDCs” are the battleground on which the UN-led post-2015 development agenda will be won or lost.
The report – subtitled Growth with Structural Transformation: A Post-2015 Development Agenda calls on the international community to learn from the failure of most of the poorest countries in meeting the Millennium Development Goals (MDGs) despite registering strong economic growth – a phenomenon the Report dubs the “LDC paradox”.
This paradox arises from the failure of LDC economies to achieve structural changes despite having grown vigorously as a result of strong export prices and rising aid flows.
According to the UN, from 2002 to 2008, LDC growth exceeded the 7 per cent target agreed by the international community, and even after the 2008 financial crisis they grew faster than other developing countries, at an average of 5.7 per cent per year.
However, only one LDC – the Lao People’s Democratic Republic – is on track to achieve all seven of the MDG targets analyzed in the report, and only four of the 39 LDCs outside South and South-East Asia (Ethiopia, Malawi, Rwanda and Uganda) are on track to meet even a majority of these targets.
Under the MDGs, global poverty was halved by rapid progress in the more advanced developing countries, the report says.
But a central goal of the post-2015 development agenda is expected to be the eradication of poverty by 2030. This means reducing it to zero everywhere – and it is in the LDCs that this will be most challenging. Their performance, the report says, will largely determine the success or failure of the whole post-2015 development agenda.
Eradicating poverty in 15 years is a much more ambitious goal than the MDG target of halving it in 25 years. Even China has not achieved this, despite extraordinary economic growth and development for twice as long.
Moreover, prospects for export prices are now much more uncertain following the financial crisis, while aid to LDCs has stopped increasing as donor countries implement austerity policies.
The report highlights three key policy priorities as part of a post-2015 development agenda for LDCs which include mobilizing resources for investment, directing these resources towards transforming economies and establishing macroeconomic policies that promote investment and demand growth. Diversifying rural economies is also critical eradicating poverty.
Donors must fulfil their long-standing commitments and critical to progress are changes in the international financial system and international trade system, and also prompt action to tackle climate change.
Development is not just about economic growth, the report notes. Development requires structural transformation of the economic base in two parallel processes: increasing labour productivity in productive activities and shifting labour from activities with low productivity – such as small-scale agriculture and services outside the formal economy – to more dynamic activities with higher productivity, such as manufacturing and high-value services.
It is not just economic growth that determines LDCs’ performance in meeting the MDGs, but the combination of these two processes of structural transformation.
The core of the post-2015 development agenda should be a virtuous circle between economic and human development, reversing the vicious circle currently trapping LDCs, the report says.
Reducing poverty, improving nutrition and health, and boosting education increase people’s productive potential.
Forty-eight countries are currently designated by the United Nations as LDCs.
European Union Annual Growth Survey 2015: A new Momentum for Jobs, Growth and Investment
The 2015 Annual Growth Survey (AGS) published by the European Commission today focuses on putting Europe firmly back on a path of sustainable job creation and economic growth. The arrival of the new Commission, with an ambitious agenda for Jobs, Growth, Fairness and Democratic Change, is the right moment to generate a new momentum. By proposing an ambitious Investment Plan to mobilise at least € 315 billion of additional public and private investment over the next three years, Europe is turning a page (Investment Plan press material). This is part of the European Commission’s overall approach to support job creation and get Europe growing. As part of this approach, the Commission, in its Annual Growth Survey 2015, recommends pursuing an economic and social policy based on three main pillars: (1) a boost to investment, (2) a renewed commitment to structural reforms and (3) the pursuit of fiscal responsibility.
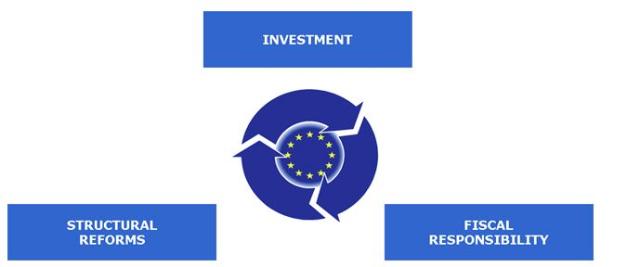
Vice-President Valdis Dombrovskis, responsible for the Euro and Social Dialogue said: “The European Union is facing a risk of prolonged low economic growth, which would aggravate the already serious social problems in parts of the Union. This is why today we propose a strategic policy mix based on investment, structural reforms and fiscal responsibility. We call for urgent action involving governments, parliaments and social partners at EU level and in each Member State. By acting together now, we can make sure that the conditions for sound and sustainable growth in the future are met and that our citizens have more opportunities for employment.”
Marianne Thyssen, EU Commissioner for Employment, Social Affairs, Skills and Labour Mobility, commented: “Job creation, social policies are at the heart of our agenda and feature prominently in the Annual Growth Survey. We should all take ownership of this. Member States that courageously reformed their labour markets have proven that reforms really pay off. This should inspire other Member States to follow suit. The € 315 billion Investment Plan that the Commission presented can boost the results to even higher levels.”
The AGS launches the annual cycle of economic governance, sets out general economic priorities for the EU and provides Member States with policy guidance for the following year. Despite the efforts made at national and EU level, the recovery of the European economy is still weak and fragile. This in turn is hampering progress in reducing the high level of unemployment and poverty. Restoring confidence and getting the entire EU to grow again can only be done by working together: it requires a determined commitment from Member States to do things differently at national level. Given the important differences between the economic situation in the Member States, the right approach will inevitably vary from country to country. To give a common direction and steer national approaches, the Commission recommends three main pillars for the EU’s economic and social policy in 2015:
1. A boost to investment
Since the global economic and financial crisis, the EU has been suffering from low levels of investment. Collective and coordinated efforts at European level are needed to reverse this downward trend and put Europe firmly on the path of economic recovery. Investments are needed to modernise welfare systems, fund education, research and innovation; to make energy greener and more efficient; to modernise transport infrastructure and to roll-out far-reaching and faster broadband.
The European Commission is ready to do its share: just two days ago, the Commission launched a € 315 billion Investment Plan for the next three years (see IP/14/2128). This “Investment Offensive” is based on three strands, which are mutually reinforcing: (1) mobilising investment finance without creating new debt; (2) supporting projects and investments in key areas such as infrastructure, education, research and innovation and (3) removing sector-specific and other financial and non-financial barriers to investment. The European Commission calls on the European Parliament and Member States to support the Investment Plan and take the necessary action swiftly so that there is a decisive effect on the European economy.
2. A renewed commitment to structural reforms
As the focus shifts from tackling emergencies stemming from the crisis to building solid foundations for jobs and growth, a renewed commitment to structural reforms is needed. At EU level, deepening the Single Market is a structural reform “par excellence”, helping our economies to modernise and to make Europe more competitive, as well as attractive for investors. Priorities include removing remaining regulatory and non-regulatory barriers across sectors such as energy, telecoms, transport and the Single Market for goods and services.
At Member State level, the Commission recommends focusing on a number of key reforms: making labour markets more dynamic and tackling the high level of unemployment; ensuring the efficiency and adequacy of pension and social protection systems; creating more flexible product and services markets; improving business investment conditions and the quality of research and innovation (R&I) investment; and making public administrations across Europe more efficient.
3. Pursuing fiscal responsibility
Progress in achieving fiscal consolidation has been significant: average fiscal deficits in the EU have been cut in just three years from 4.5% of GDP in 2011 to around 3.0% of GDP in 2014. The decrease in the number of countries under an excessive deficit procedure – down to 11 in 2014 from 24 in 2011 – reflects these fiscal improvements, which were instrumental in restoring confidence in the soundness of our public finances and stabilising the financial situation. Securing long-term control over deficit and reducing high debt levels remains a key building block towards sustainable growth. We need responsible and growth-friendly fiscal policies, in line with the Stability and Growth Pact, taking into account the particular national situation. Countries with more fiscal space have more scope to encourage domestic demand and investment. Tax systems need to become fairer and more efficient and tax fraud and evasion must be tackled decisively.
Streamlining European Economic Governance
The European Commission also proposes to streamline and reinforce the European Semester by giving it a sharper focus and a more political role based on the three pillars of the Annual Growth Survey. A more focused European Semester should strengthen the social market economy and increase the effectiveness of economic policy coordination at the EU level through an increased accountability and an improved ownership by all actors, including social partners. The new economic policy cycle will also simplify Commission outputs and reduce reporting requirements of Member States, while making the process more open and multilateral (see Annex 1 and MEMO/14/2180).
The Alert Mechanism Report
The Annual Growth Survey is accompanied by the Alert Mechanism Report (AMR), which is part of the regular surveillance under the Macroeconomic Imbalances Procedure, and aims to identify and address imbalances that may hinder the performance of national economies, the euro area, or the EU as a whole. Employment and social indicators are being introduced into the macroeconomic imbalances procedure and should be used to gain a better understanding of the labour market and social developments and risks.
This AMR shows that even though EU Member States have made progress towards correcting some of their imbalances and competitiveness has improved in several economies, macroeconomic imbalances and their major social consequences remain a serious concern. The slow recovery and the very low inflation have been an obstacle to a more pronounced reduction of the imbalances and related macroeconomic risks.
Moreover, the rebalancing of current accounts remains asymmetric. Although deficits have been reduced in a number of countries, the process has been largely driven by falling demand and more particularly, falling investment. This could have negative implications for medium-term growth potential if not corrected. Meanwhile, Germany and the Netherlands have continued to record very high current account surpluses, which reflect weak domestic demand and investment.
As regards individual countries, the Commission finds that further analyses (in-depth reviews) are warranted to examine in detail the accumulation and unwinding of imbalances and their related risks in 16 Member States: Belgium, Bulgaria, Germany, Ireland, Spain, France, Croatia, Italy, Hungary, the Netherlands, Portugal, Romania Slovenia, Finland, Sweden and the United Kingdom
Joint Employment Report
The Annual Growth Survey 2015 is also accompanied by the publication of the Commission proposal for the Joint Employment Report. It analyses the employment situation in Europe and the policy responses by Member States. The report shows that substantial structural reforms pay off. It also analyses the potential for improving the employment and social performance of the EU as a whole (for more details, see MEMO/14/2234).
Annex
1. Timeline of the streamlined European Semester
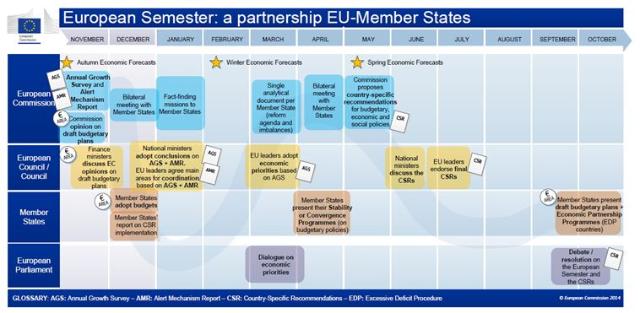
2. Key findings of the Commission’s autumn 2014 forecast
Real GDP growth is expected to reach 1.3% in the EU and 0.8% in the euro area for 2014 as a whole. This should rise slowly in 2015, to 1.5 % and 1.1% respectively, as foreign and domestic demand improve. For 2016, an acceleration of economic activity to 2.0% and 1.7% respectively is expected.
Unemployment reached 24.6 million people in August 2014 – 5 million are aged between 15 and 24. Long-term unemployment is very high. Unemployment rates strongly vary across Member States, from 5.1% in Germany and 5.3% in Austria to 24.8% in Spain and 26.8% in Greece in 2014.
The low inflation trend is expected to continue this year, with lower commodity prices, in particular for energy and food, and the weaker-than-expected economic outlook. The gradual recovery of economic activity over the forecast horizon is expected to lead to an increase in inflation in the EU, from 0.6% in 2014 to 1.0% in 2015 and 1.6% in 2016.
The deficit-to-GDP ratios are set to decrease further this year, albeit more slowly than in 2013, from 4.5% in 2011 to respectively 3.0% for the EU and 2.6% for the euro area. Government deficits are forecast to continue falling over the next two years, driven by strengthening economic activity. The debt-to-GDP ratios of the EU and the euro area are expected to peak next year at 88.3% and 94.8% respectively and remain high in a number of countries.
3. Examples of effective structural reforms in the Member States
In Spain, in December 2013, the government approved a Law guaranteeing market unity in the interest of the freedom of movement and establishment of persons and the free movement of goods. The law is an ambitious rationalisation of overlapping legislation in Spain, addressing the fragmentation of the domestic market and increasing competition in product markets. According to the Spanish Authorities, the reform is estimated to raise GDP by more than 1.5% over time.
Portugal enacted a number of labour market reforms between 2011 and 2013. The protection of workers under permanent and fixed-term contracts was aligned. Working time legislation was made more flexible, and measures were taken to better adapt wages to productivity at the firm level. Unemployment benefits were reformed and eligibility was extended. The Public Employment Service was reformed, existing Active Labour Market Policies were reviewed and new programmes introduced, including targeted to the youth. The unemployment rate declined by about 2 percentage points between 2013 and 2014.
Poland initiated an ambitious reform facilitating access to regulated professions. Access to 50 professions – including lawyers, notaries, real estate agents and taxi drivers – has been liberalised in the first wave of reform in 2013. Decisions covering a further 91 professions were adopted by the Polish Parliament in April 2014 and deregulation of 101 additional professions is planned for early 2015.
Italy implemented a set of measures in 2013 aimed at increasing competition and transparency in the gas and electricity markets. The initiatives taken by the Italian government have helped to address the long-standing issue of high energy prices in Italy and, according to estimates from the energy regulator, have helped to reduce end-users prices.
US Economy Grows Faster Than First Forecast According To Bureau Of Economic Analysis
Real gross domestic product — the value of the production of goods and services in the United States, adjusted for price changes — increased at an annual rate of 3.9 percent in the third quarter of 2014, according to the “second” estimate released by the Bureau of Economic Analysis. In the second quarter, real GDP increased 4.6 percent.
The GDP estimate released today is based on more complete source data than were available for the “advance” estimate issued last month. In the advance estimate, the increase in real GDP was 3.5 percent. With the second estimate for the third quarter, private inventory investment decreased less than previously estimated, and both personal consumption expenditures (PCE) and nonresidential fixed investment increased more. In contrast, exports increased less than previously estimated.
The increase in real GDP in the third quarter reflected positive contributions from PCE, nonresidential fixed investment, federal government spending, exports, residential fixed investment, and state and local government spending that were partly offset by a negative contribution from private inventory investment. Imports, which are a subtraction in the calculation of GDP, decreased.
The deceleration in the percent change in real GDP reflected a downturn in private inventory investment and decelerations in exports, in nonresidential fixed investment, in state and local government spending, in PCE, and in residential fixed investment that were partly offset by a downturn in imports and an upturn in federal government spending.
The price index for gross domestic purchases, which measures prices paid by U.S. residents, increased 1.4 percent in the third quarter, 0.1 percentage point more than in the advance estimate; this index increased 2.0 percent in the second quarter. Excluding food and energy prices, the price index for gross domestic purchases increased 1.6 percent in the third quarter, compared with an increase of 1.7 percent in the second.
Real personal consumption expenditures increased 2.2 percent in the third quarter, compared with an increase of 2.5 percent in the second. Durable goods increased 8.7 percent, compared with an increase of 14.1 percent. Nondurable goods increased 2.2 percent, the same increase as in the second quarter. Services increased 1.2 percent, compared with an increase of 0.9 percent.
Real nonresidential fixed investment increased 7.1 percent in the third quarter, compared with an increase of 9.7 percent in the second. Investment in nonresidential structures increased 1.1 percent, compared with an increase of 12.6 percent. Investment in equipment increased 10.7 percent, compared with an increase of 11.2 percent. Investment in intellectual property products increased 6.4 percent, compared with an increase of 5.5 percent. Real residential fixed investment increased 2.7 percent, compared with an increase of 8.8 percent.
Real exports of goods and services increased 4.9 percent in the third quarter, compared with an increase of 11.1 percent in the second. Real imports of goods and services decreased 0.7 percent, in contrast to an increase of 11.3 percent.
Real federal government consumption expenditures and gross investment increased 9.9 percent in the third quarter, in contrast to a decrease of 0.9 percent in the second. National defense increased 16.0 percent, compared with an increase of 0.9 percent. Nondefense increased 0.4 percent, in contrast to a decrease of 3.8 percent. Real state and local government consumption expenditures and gross investment increased 0.8 percent, compared with an increase of 3.4 percent.
The change in real private inventories subtracted 0.12 percentage point from the third-quarter change in real GDP after adding 1.42 percentage points to the second-quarter change. Private businesses increased inventories $79.1 billion in the third quarter, following increases of $84.8 billion in the second quarter and $35.2 billion in the first.
Real final sales of domestic product — GDP less change in private inventories — increased 4.1 percent in the third quarter, compared with an increase of 3.2 percent in the second.
Gross domestic purchases
Real gross domestic purchases — purchases by U.S. residents of goods and services wherever produced — increased 3.0 percent in the third quarter, compared with an increase of 4.8 percent in the second.
Gross national product
Real gross national product — the value of the goods and services produced by the labor and property supplied by U.S. residents — increased 3.8 percent in the third quarter, compared with an increase of 4.6 percent in the second. GNP includes, and GDP excludes, net receipts of income from the rest of the world, which decreased $1.6 billion in the third quarter, in contrast to an increase of $1.4 billion in the second; in the third quarter, receipts decreased $1.1 billion, and payments increased $0.5 billion.
Current-dollar GDP
Current-dollar GDP — the market value of the production of goods and services in the United States — increased 5.3 percent, or $227.0 billion, in the third quarter to a level of $17,555.2 billion. In the second quarter, current-dollar GDP increased 6.8 percent, or $284.2 billion.
Gross domestic income
Real gross domestic income (GDI), which measures the value of the production of goods and services in the United States as the costs incurred and the incomes earned on that production, increased 4.5 percent in the third quarter, compared with an increase of 4.0 percent (revised) in the second. For a given quarter, the estimates of GDP and GDI may differ for a variety of reasons, including the incorporation of largely independent source data. However, over longer time spans, the estimates of GDP and GDI tend to follow similar patterns of change.
Revisions
The upward revision to the percent change in real GDP primarily reflected upward revisions to private inventory investment, to personal consumption expenditures, and to nonresidential fixed investment that were partly offset by a downward revision to exports and an upward revision to imports.
Profits from current production
Profits from current production (corporate profits with inventory valuation adjustment (IVA) and capital consumption adjustment (CCAdj)) increased $43.8 billion in the third quarter, compared with an increase of $164.1 billion in the second.
Profits of domestic financial corporations increased $20.3 billion in the third quarter, compared with an increase of $33.3 billion in the second. Profits of domestic nonfinancial corporations increased $22.5 billion, compared with an increase of $134.3 billion. The rest-of-the-world component of profits increased $1.0 billion, in contrast to a decrease of $3.6 billion. This measure is calculated as the difference between receipts from the rest of the world and payments to the rest of the world. In the third quarter, receipts were unchanged, and payments decreased $1.0 billion.
Taxes on corporate income decreased $4.8 billion in the third quarter, in contrast to an increase of $45.7 billion in the second. Profits after tax with IVA and CCAdj increased $48.6 billion, compared with an increase of $118.4 billion.
Dividends decreased $3.9 billion in the third quarter, compared with a decrease of $0.5 billion in the second. Undistributed profits increased $52.5 billion, compared with an increase of $118.8 billion. Net cash flow with IVA — the internal funds available to corporations for investment — increased $25.1 billion, compared with an increase of $133.4 billion.
Tje IVA and CCAdj are adjustments that convert inventory withdrawals and depreciation of fixed assets reported on a tax-return, historical-cost basis to the current-cost economic measures used in the national income and product accounts. The IVA increased $16.8 billion in the third quarter, compared with an increase of $11.9 billion in the second. The CCAdj increased $1.2 billion, in contrast to a decrease of $0.8 billion.
Gross value added of nonfinancial domestic corporate business
In the third quarter, real gross value added of nonfinancial corporations increased, and profits per unit of real gross value added increased. The increase in unit profits reflected an increase in unit prices that was partly offset by an increase in unit nonlabor costs; unit labor costs were unchanged.
Investing in Europe: Speech by President Juncker in the European Parliament on the € 315 billion Investment Plan
1. Introduction – Turning a page
Dear President, dear honourable Members of Parliament, Ladies and Gentlemen,
I addressed this house just over a month ago and I promised to present an ambitious Investment Plan before Christmas. One month later and Christmas has come early – I am here to deliver on my promise.
And I am presenting it in the Parliament, because that is where important things should happen.
Today Europe is turning a page. After years of fighting to restore our fiscal credibility and to promote reform, today we are adding the third point of a virtuous triangle: An ambitious, yet realistic ‘Investment Plan for Europe’. Europe needs a kick-start and today the Commission is supplying the jump cables.
Investing in Europe: It means much more than figures and projects, money and rules. We need to send a message to the people of Europe and to the rest of the world: Europe is back in business. This is not the moment to look back. Investment is about the future.
Of course, we should never neglect the sacrifices that many in Europe made over the past 6 years to overcome the crisis. Nor should we stop the push to bring down barriers, open up markets and reform what doesn’t work in our economies. These are necessary, but not sufficient conditions for growth.
We need structural reforms to modernise and preserve our social market economy. We need fiscal responsibility to restore confidence and the sustainability of our public finances. And to complete this virtuous omne trium perfectum (rule of three) we now need to boost investment. No tree can grow on soil and air alone, the Investment Plan we are presenting today is the watering can.
For the first time, the European Commission is presenting all three components of Europe’s future economic success together. Not pitched one against the other, but grouped in one single, simple message: Namely, that Europe can offer hope both to its future generations and to the rest of the world, as a promising, attractive hub for jobs, growth and investment.
2. Why are we doing this?
First, because not only are we faced with a serious investment gap; we are caught in an investment trap. When I talk to investors, they all agree that Europe is an attractive place to invest in. But then I look at the figures, they tell a different story: investment levels in the EU are down to €370 billion below the historical pre-crisis norms. While investment is taking off in the U.S., Europe is lagging behind. Why? Because investors lack confidence, credibility and trust.
Secondly, because we are confronted with a major paradox: despite the huge liquidity in the world’s money markets and corporate bank accounts, investment in Europe is not rebounding.
Thirdly, because our public resources are stretched: our debt levels have increased from 60% of our GDP to 90% in the space of just a few years. Public expenditure already represents close to 50% of EU GDP. What we need is a smart use of public money, geared to unlocking investment. Public expenditure should be used for what it is best at doing: funding our schools and welfare systems, not servicing our debt.
Today we are responding to these European pathologies and keeping our eye on the one ball that matters: the real economy. This is not the time for national, political or ideological fights. It is time for a major political and social consensus, a grand bargain to put Europe back to work.
I often hear that we need ‘fresh’ money. What I believe we really need is a fresh start and fresh investment. Others say we need more debt. We do not. National budgets are already stretched. The EU operates on balanced budgets and the abundant liquidity can allow Europe to grow without creating new debt. We will not betray our children and grandchildren and write more checks that they will ultimately have to pay off. We will not betray the rules of the Stability and Growth Pact that we have agreed jointly – this is a matter of credibility. However, if Member States chip in capital to the Fund, we will not take these contributions into account in our assessments under the Pact.
What we are going to do is to set up the right system that will use available public money to leverage additional capital that would have never otherwise been mobilised. Every public euro mobilised can generate additional investment that would not have happened otherwise. And it can create jobs.
We will need to look carefully at projects. Destinations for the fresh investment drive should be attractive, free of regulatory burdens and linked to economic reality, not political expedience.
Let me clear about one thing – the money we are putting forward today comes on top of what already exists. It comes on top of the €630 billion that is about to be unlocked from the structural and investment funds at national and regional level. It comes on top of what the European Investment Bank has already been able to do so far. After the capital increase of €10 billion, the EIB shipped €180 billion to the real economy. It comes on top of EU programmes such as the Connecting Europe Facility, Horizon 2020 and ‘COSME’ which are already investing in infrastructure, innovation and Europe’s SMEs.
Perhaps most importantly, it comes on top of what Member States can do to help themselves. For Member States must also support the investment environment through a better use of public money and a greater commitment to structural reforms.
Let me explain what my vision is for where this money should go:
I have a vision of school children in Thessaloniki walking into a brand new classroom, decked out with computers.
I have a vision of a hospital in Florence saving lives with state-of-the-art medical equipment.
I have a vision of a French commuter being able to charge his electric car along the motorway in the same way we fill up on petrol today.
Households and companies want to benefit from technological progress and are crying out for action to become more energy-efficient.
Our energy sector needs to interconnect networks and markets, integrate renewable sources of energy and diversify our sources of supply.
Our transport sector has to modernise its infrastructure, reduce congestion and improve trade connections. Our environment needs better waste, recycling and water treatment facilities.
We need far-reaching and faster broadband and smarter data centres across Europe.
And we need to invest in our education and innovation systems that are often underfunded and less equipped than those of our key competitors. Investing in people –this is what the social market economy is about. In Europe; we spell ‘social’ with a capital ‘S’.]
The needs are vast. This is the challenge of a generation. Europe will have to face it head on.
3. How is it going to work?
Money will not fall from the sky. We do not have a money printing machine. We will have to attract money and make it work for us. Today we are setting up a new architecture that will make this possible. The key is to provide a risk-bearing capacity that can unlock additional investment.
Our Plan is built on three main pillars (“filières”):
1. We are creating a new European Fund for Strategic Investments, guaranteed with public money from the EU budget and the European Investment Bank (EIB). The Fund will be able to mobilise €315 billion over the next three years.
The Commission has put up €8 billion from the EU budget. This backs up a €16 billion guarantee given to the Fund. Topped up by another €5 billion from the EIB. That makes €21 billion.With a €21 billion reserve, the EIB can give out loans of €63 billion. That’s €63 billion of fresh financing we’ve just injected into the economy. But the EIB will not be acting alone. The EIB will be financing the riskier parts of projects worth 315 billion, meaning private investors will be pitching in the remaining €252 billion.
And yet some say this is not enough. This is the greatest effort in European history to mobilise the EU’s budget to trigger additional investment – and without changing the rules. We have managed to pull an unprecedented €8 billion out of the EU budget! Just ask your national governments how difficult it is to make those kinds of savings.
I know some of you are worried about the impact on the research and infrastructure allocations. You fear that redirecting money from the Horizon 2020 and Connecting Europe budget lines will mean that money is lost. But this is not the case. Every euro from these programmes paid into the Fund creates €15 euros for those very same research and infrastructure projects. We are not just moving money around, we are maximising its input.
If Member States step up to the plate and contribute to the Fund, then the knock-on effect of this significant amount will be even bigger.
2. We are setting up a credible project pipeline backed by a technical assistance programme to link investments to mature, growth-generating projects of European significance. It is not the job of politicians to choose projects. It will be done by the technicians who have the experience and know-how to do so. The Fund will have a dedicated Investment Committee made up of experts that will have to validate every project from a commercial and societal perspective and based on what value-added they can have to the EU as a whole.
3. We are proposing an ambitious roadmap to make Europe more attractive and remove red-tape and regulatory bottlenecks. The answer is not just financial. It is also regulatory. A single EU Regulation can replace 28 sets of laws. This is the best simplification machine.
The EIB has done a great job in recent years, and I am delighted that they will remain a central player and partner in Europe’s new Investment Plan. Werner, the triple-A of your institution is a European treasure that we will now put to even better use for Europe. We couldn’t have done this without you. I wish to pay tribute to you, Werner, and your team for everything you have done so far and thank you for what you will still have to do over the next three years. Indeed, Werner and I had a comprehensive exchange of views on this already in July.
There are still important steps that we need to take as of tomorrow. This is only the beginning.
That is why today I want to call on all those who say they to want to put Europe back on the path of strong growth:
1. Member States should join in and multiply the impact of the Fund even further. Every public Euro mobilised in the Fund can generate about €15 of investment. My pledge to you in turn, as I already mentioned, is that in the assessment of public finances under the Stability and Growth Pact, the Commission will not count such capital contributions to the Fund. That’s European solidarity. That’s what working together for the greater good looks like.
Some of you will ask me – what’s in it for me? Why would a Member States contribute to the fund when there is no guarantee how much they will get back? Because geographical silos will not serve anyone. France growing is good for Italy. Southern Europe growing is good for Germany. We are all in this together. Our fates are linked. We should stand shoulder to shoulder.
2. The €315 billion of total expected investment is not a ceiling. If we are successful, as I believe we will be, we can even go beyond this.
3. We need a broad political consensus in the European Parliament and the European Council that will endorse the Investment Plan and validate its content, structure and objectives. We need a Coalition of the ‘willing to invest’.
Honourable members, I will notably count on the commitment of this House to fast-track the legislation necessary to set up the Fund. I will ask colleagues at the European Council for the same commitment. We have to get the Fund up and running by June next year so that it can start delivering.
The European Parliament is a key partner in bringing Europe back to growth. We will be accountable to you. High-level representatives of the new Fund should regularly report to you on the activities of the Fund. I will also guarnatee that the relevant Vice-Presidents and European Commissioners responsible for the different areas of activities of the Fund, as well as EIB representatives will regularly report to you and your relevant Committees.
Let me, however, be very clear: we need political endorsement and backing, but not politicisation of the Plan. No political fiddling with projects, no national wish-lists. This is a major credibility test that has to be convincing to private investors and the world financial markets. Here too, I count on the EIB’s professionalism, experience and expertise.
The Plan is not an ATM and the Fund will not be a bank. We need something agile. Something which is simple for investors and public authorities to use. Something that can evolve and develop over time. Not constrained by the “silo” logic of thematic, sectoral or geographic pre-allocations. Something credible that builds on established structures and guarantees accountability.
What we propose here can be done at EU level alone. Less than a month into the mandate of my Commission, we are taking responsibility and we are delivering. I now invite others to follow suit and show they too are ready to play ball.
And this does not have to be one-off. Today’s Plan is a first test case. If it works, who is to say it could not become a permanent feature?
4. No way back
This is an investment offensive that optimises our economic policy. We are focusing on long-term, large-scale European investment to create jobs. We are also targeting SMEs – Europe’s job creators – to give a boost to the real economy.
We are turning a corner, completing fiscal responsibility and structural reform with innovative investment plans and instruments. This ground-breaking investment plan, mobilising all levels of government, is the missing part of the puzzle, the third point in the virtuous triangle. The omne trium perfectum made whole.
We will stand tall on three pillars: the money, the projects and the rules to create the right business environment.
We are offering hope to millions of Europeans disillusioned after years of stagnation. Yes, Europe can still become the epicentre of a major investment drive. Yes, Europe can grow again. Yes, the European social model will persevere.
Now that we are going in the right direction, there will be no turning back.
Thank you.
Jean-Claude Juncker
President of the European Commission
Metlife Completes Merger Of Three Life Insurance Companies And Former Offshore Reinsurance Subsidiary
NEW YORK, – MetLife, Inc. (NYSE: MET) today announced that it had completed the mergers of its subsidiaries MetLife Insurance Company of Connecticut, MetLife Investors USA Insurance Company, MetLife Investors Insurance Company and Exeter Reassurance Company Limited. The merged company has been renamed MetLife Insurance Company USA and is domiciled in Delaware. All necessary regulatory approvals have been received for these mergers.
At its Investor Day meeting in May 2013, MetLife announced it would merge these subsidiaries to better position the company to comply with Dodd-Frank collateral requirements, proactively address regulatory issues surrounding the use of captive reinsurance companies, and improve the risk profile and transparency of MetLife’s U.S. variable annuity business. The decision was part of MetLife’s larger effort to de-risk its variable annuity business.
All policy, contract, certificate or retained asset account terms, conditions or benefits remain unchanged as a result of the merger.
About MetLife
MetLife, Inc. (NYSE: MET), through its subsidiaries and affiliates (“MetLife”), is one of the largest life insurance companies in the world. Founded in 1868, MetLife is a global provider of life insurance, annuities, employee benefits and asset management. Serving approximately 100 million customers, MetLife has operations in nearly 50 countries and holds leading market positions in the United States, Japan, Latin America, Asia, Europe and the Middle East. For more information, visit www.metlife.com.
Prudential Annuities Adds Fund To Leading Investment Lineup To Reinforce Flexibility And Oversight
NEWARK, N.J., – Prudential Annuities, the domestic annuity business for Prudential Financial, Inc. (NYSE:PRU), today announced a new asset allocation portfolio available with its Prudential Premier Retirement variable annuities that offer the Highest Daily Lifetime Income v3.0 benefit.
The addition of the AST TM Legg Mason Diversified Growth Portfolio brings the total number of asset allocation portfolios available to 23, and was designed to appeal to investors seeking growth with a disciplined strategy for downside risk management.
Highlights of the new portfolio include:
85% equities and 15% fixed income
Blends quantitative and fundamental strategies resulting in greater stability and return potential
Risk-aware focus to help manage downside volatility while providing upside potential
Diversified across multiple Legg Mason affiliated managers.
“Our new asset allocation portfolio was designed to offer investors additional opportunities to achieve returns, while maintaining appropriate levels of risk,” said Timothy Cronin, Chief Investment Officer for Prudential Annuities. “It is through our innovative approach to risk management that we can offer investors access to a broad and complementary range of innovative investment strategies.”
There are also changes to the AST New Discovery and AST Advanced Strategies Asset Allocation Portfolios, highlighting Prudential’s commitment to emerging managers:
Vision Capital Management will replace Brown Advisory in the Large-Cap Growth sleeve of the AST New Discovery Asset Allocation portfolio. Brown Advisory will remain on the investment platform and will manage a sleeve in the AST Advanced Strategies Portfolio.
Longfellow Investment Management Co. LLC will replace the current subadvisor of the Core Plus Fixed Income sleeve of the AST New Discovery Asset Allocation Portfolio.
Other notable changes to Prudential Annuities’ single asset class portfolios, also effective today, include:
AST Boston Partners Large-Cap Value Portfolio will replace AST Jennison Large-Cap Value Portfolio
AST Small-Cap Growth Opportunities Portfolio will replace AST Federated Aggressive Growth Portfolio, and will be managed by RS Investment Management and Wellington Management.
Lazard Asset Management LLC will replace Thornburg Investment Management, Inc. in the AST International Value Portfolio.
“Our industry continues to face growing demand from investors who seek solutions that offer income certainty in retirement,” said Bruce Ferris, president, Prudential Annuities Distributors. “Today’s announcement allows financial professionals to offer their clients access to a broader range of investments and strategies to help meet their individual financial planning goals, and help ensure they can enjoy a successful retirement.”
Prudential Annuities, a division of Prudential Financial, Inc., creates and markets variable annuity products that provide tax advantages for those saving for retirement, and a way to transition their savings into guaranteed income they cannot outlive. Learn more at https://incomecertainty.prudential.com/
Prudential Financial, Inc. (NYSE: PRU), a financial services leader, has operations in the United States, Asia, Europe, and Latin America. Prudential’s diverse and talented employees are committed to helping individual and institutional customers grow and protect their wealth through a variety of products and services, including life insurance, annuities, retirement-related services, mutual funds and investment management. In the U.S., Prudential’s iconic Rock symbol has stood for strength, stability, expertise and innovation for more than a century. For more information, please visit http://www.news.prudential.com/
*All references to income certainty and guarantees are backed by the claims-paying ability of the issuing company.
Investors should consider the features of the contract and the underlying portfolios’ investment objectives, policies, management, risks, charges and expenses carefully before investing. This and other important information is contained in the prospectus, which can be obtained from your financial professional. Please read the prospectus carefully before investing.
Variable annuities are issued by Pruco Life Insurance Company (in New York, by Pruco Life Insurance Company of New Jersey), Newark, NJ (main office) and distributed by Prudential Annuities Distributors, Inc., Shelton, CT. All are Prudential Financial companies and each is solely responsible for its own financial condition and contractual obligations. Prudential Annuities is a business of Prudential Financial, Inc.
Annuity contracts contain exclusions, limitations, reductions of benefits, and terms for keeping them in force. Your licensed financial professional can provide you with complete details.
A variable annuity is a long-term investment designed for retirement purposes. Investment returns and the principal value of an investment will fluctuate so that an investor’s units, when redeemed, may be worth more or less than the original investment. Withdrawals or surrenders may be subject to contingent deferred sales charges.
An excess withdrawal occurs when your cumulative Lifetime Withdrawals exceeds the income amount allowed by the product or living benefit in an annuity year. If an excess withdrawal is taken, only the portion of the Lifetime Withdrawal that exceeds the remaining income amount for that year will proportionally reduce the guarantee for future years. If a withdrawal in excess of the income amount reduces the account value to zero, no further amount would be payable and the contract terminates.
Asset allocation does not ensure a profit or protect against a loss.
Variable annuities offered by Prudential Financial companies are available at a total annual insurance cost of 0.55% to 1.95% (depending on the product chosen) with an additional fee related to the professionally managed investment options. Note: All products may not be available through all third party broker/dealers.
Prudential Annuities and its distributors and representatives do not provide tax, accounting, or legal advice. Please consult your own attorney or accountant.